An Epic Blowout


 The FED’s easy money has encouraged rampant energy speculation and over-investment, resulting in more than $500 billion in new loans and investments in just the past 4 years. And so long as Crude prices stayed comfortably above $90, investments made money and everyone was happy. But once energy prices started falling, the decline quickly became a negative loop-back effect because the very high levels of leverage could not tolerate the move. Whenever asset prices fall in a highly levered market, there is often a sudden lack of liquidity to absorb the speculators’ need to unwind leverage, leading to desperation and fire sales. In the case of energy, the sudden disappearance of “investors” highlights just how speculative the underlying market had become.
It’s not exactly a Black Swan event, since Crude and other assets occasionally move with incredible ferocity. But to a highly levered and speculative population who chose to ignore the risks as being far too improbable to worry about, it’s a situation where debt cannot be offloaded at any reasonable price. At $55 bbl Crude prices, much of the new debt simply does not work, meaning that significant energy company junk bond defaults will occur. Although this is obviously bad for the energy complex, it also has very real implications for broader systemic risk.
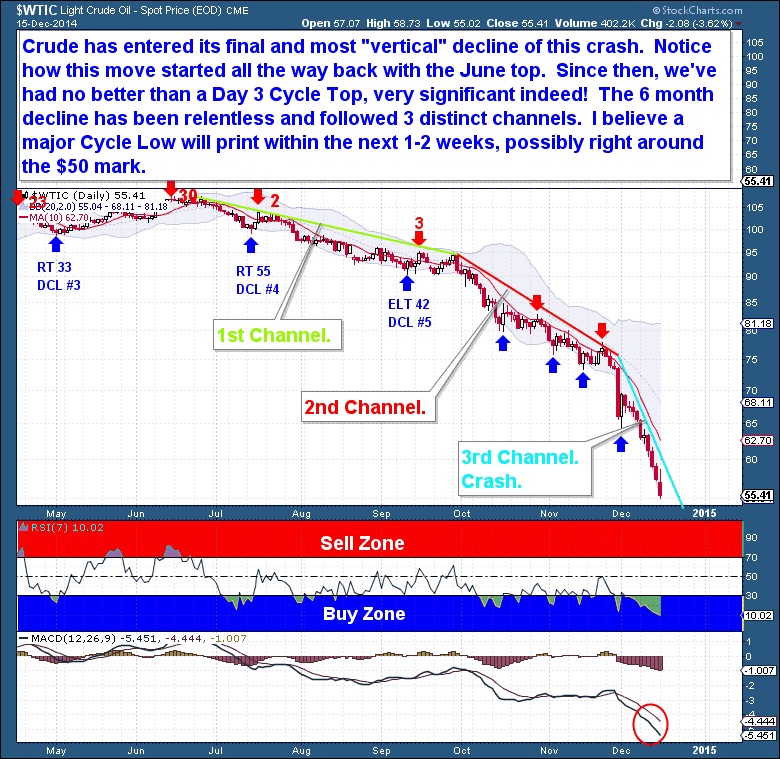
The only saving grace may be that it appears that Crude has entered the final, vertical decline of the crash. A bottom in the $50 range is in no way guaranteed, but it is likely that the low will come in the near future. Notice on the below chart that the current move down started from a June top. Since then, we’ve had no better than a Day 3 Cycle top, showing just how extremely Left Translated recent Cycles have been. The chart also shows how relentless the downward move has been, and the 3 distinct channels it has taken. Within each channel, the declines have taken on a steeper, more vertical aspect, to the point that Crude prices are now near free-fall.
When a market enters into crash mode, there is no way to know where it will bottom. Unlike Crude, the energy producers have, to date, held up relatively well. And recently, they put in a very convincing counter-trend rally at the same time Crude appeared to be finding a bottom. But unless Crude does find a bottom, and quickly, the energy producers will, I believe, be punished with extreme prejudice, as we’ve yet to see “crash-like” selling in many of the names.
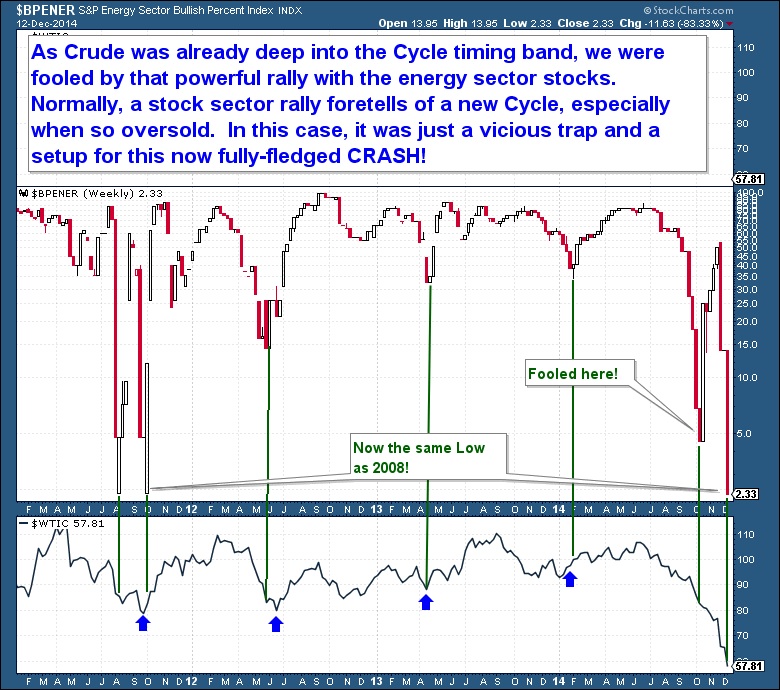
As is clear on the below chart, Crude was already deep into the timing band for a Low when energy producers rallied, fooling everyone into believing that a new Cycle was already underway. Normally, a sector rally in equities foretells a new Cycle, especially in an oversold, extended asset. In this case, it was just a vicious trap, a setup for the crash we’re seeing now!
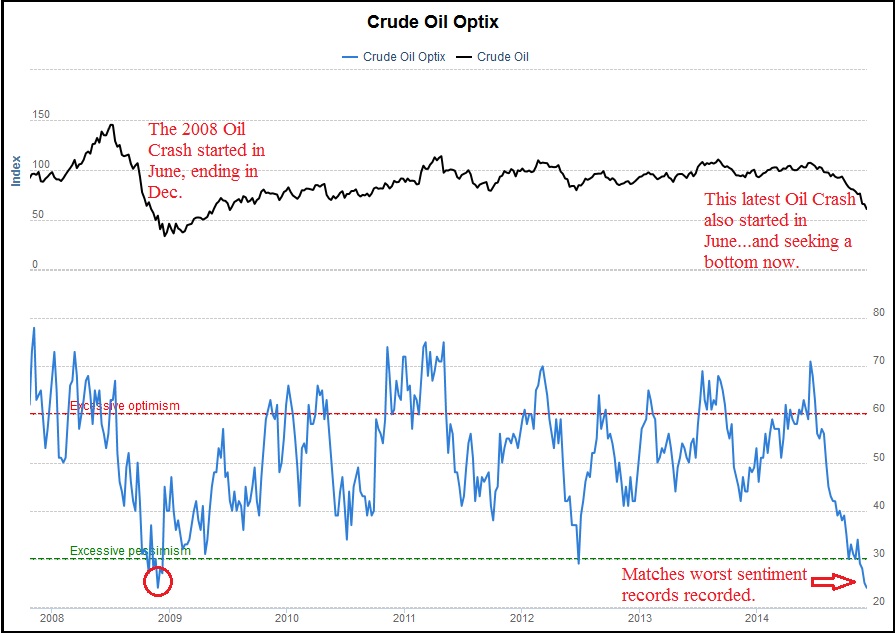
I’ve shown Crude’s sentiment chart a number of times in the past few months, so I know it should be taken lightly when used to discuss Cycle timing. But I’m presenting it again because we now have a situation where sentiment is matching that seen during the massive crash of 2008. There comes a time, even during a bear market, where the market can’t absorb more selling, where it becomes exhausted of sellers. I’m not sure if we’re there yet in Crude, but based on this chart, it’s clearly imminent.
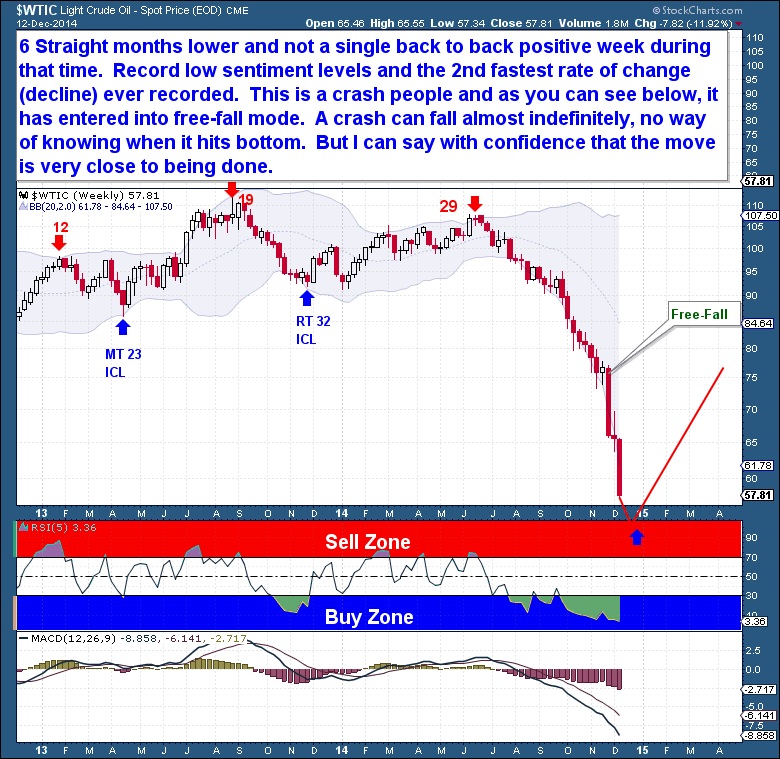
This crash has been a long time in the making, and has seen 6 consecutive months of lower prices without a single instance of back-to-back weekly gains! As a result, we have record low sentiment levels on the heels of the 2nd fastest rate of change (decline) ever recorded. This is a crash, no way around it. The effects on the industry will be long lasting.
As we can see below, price has entered free-fall. Cycle timing is out the window in this sort of scenario, as price can fall almost indefinitely, technically to zero. There is no way of knowing when it will bottom, but of interest is that the 2008 crash also began with a June top and ended with a December low, a 6 month decline. All that we can say with confidence is that the current move down should be very close to finished.
********
The Financial Tap publishes two member reports per week, a weekly premium report and a midweek market update report. The reports cover the movements and trading opportunities of the Gold, S&P, Oil, $USD, US Bond’s, and Natural Gas Cycles. Along with these reports, members enjoy access to two different portfolios and trade alerts. Both portfolios trade on varying time-frames (from days, weeks, to months), there is a portfolio to suit all member preferences.
More from Silver Phoenix 500


