Equities, Gold, Silver & Oil Active Trader Report


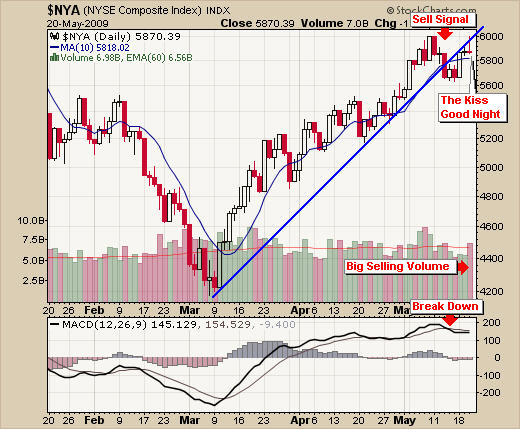
The broad market has been moving higher with great force the past 2 months. I have been expecting a top for the past 2-3 weeks. It looks like the market is starting to come in (sell off).
Few quick points which I think are interesting:
- Gold started to sell off about 10 days before equities rallied as money was pulled from the golden safe haven and rotated back into stocks. Now gold is moving higher and the broad market is starting to roll over.
- I find the broad market moves in 6-8 week cycles and it looks like the market peaked last week (week 8).
- Looks like we had some capitulation volume during the top last week and big selling again today as equities tested the high.
- Trading inverse etf funds I find are the best way to take advantage of this possible setup. Members will be able to profit from the lowest risk setup I can find.
The Gold Sector
Gold had a nice move higher today with fears of inflation, the broad market correcting and the USD which is dropping like a rock. I have provided a few charts to help you get a better view of what's happening and how I see things.
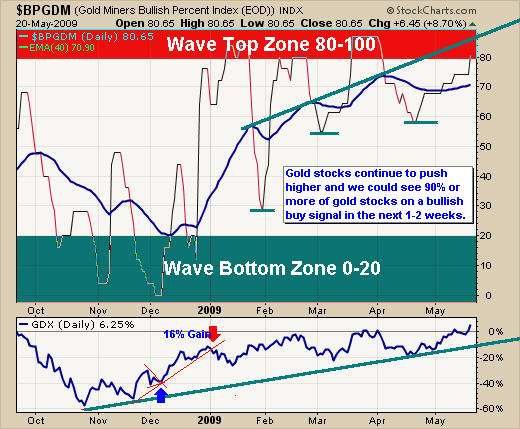
The Bullish Percent Index of Gold Miner Stocks
This chart tells us the percentage of gold mining stocks which are currently on a point and figure buy signal. Currently 80% of gold stocks are in a bullish chart pattern and the good news is that we can still see this chart move to the 90 and even 100 level.
I like to watch this chart for short term over bought or over sold levels which occurs when this chart is in the Wave Top or Wave Bottom Zones. This allows me to tighten my stops to lock in short term profits.
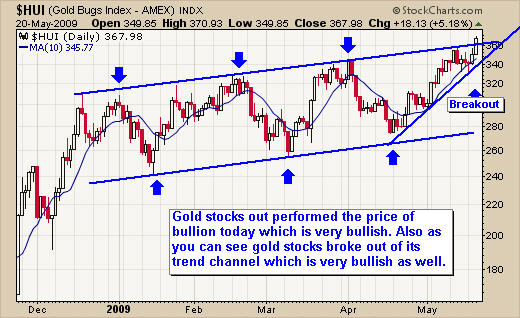
Gold Stocks Price Action
As you can see from the chart below, gold stocks broke out of their trend channel this week. It will be exciting to watch and see what happens over the next few days. This type of price action is what the broad market did in March and April. As prices break through the top trend line we could very well see a jump in prices as investors panic and buy into gold stocks so they do not miss the next move.
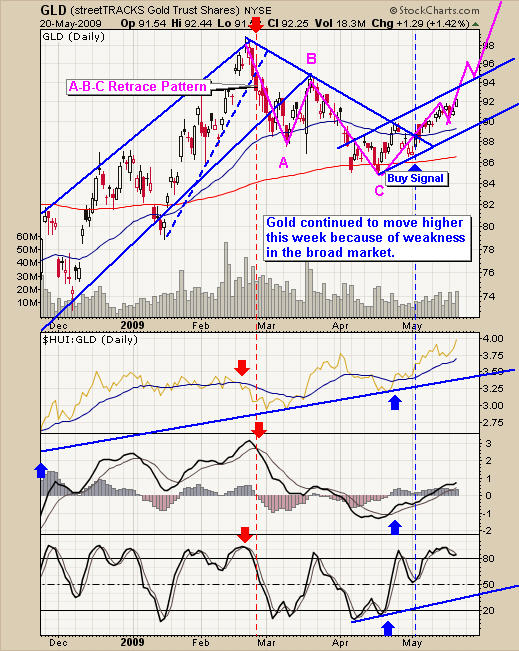
Gold GLD Active Trading Chart
Gold looks like it wants to run higher but it will find resistance at the upper channel trend line. If this price level is breached then I think we will see gold surge much higher.
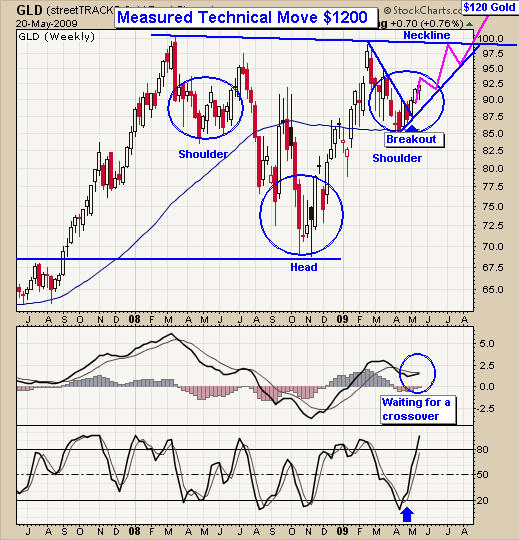
Weekly View of Gold
Here is a quick look at the weekly chart of gold. It shows that prices may take a few months for gold to retest the $1000 level if the trend continues higher. The large reverse head and shoulders pattern looks very promising for higher prices as well.
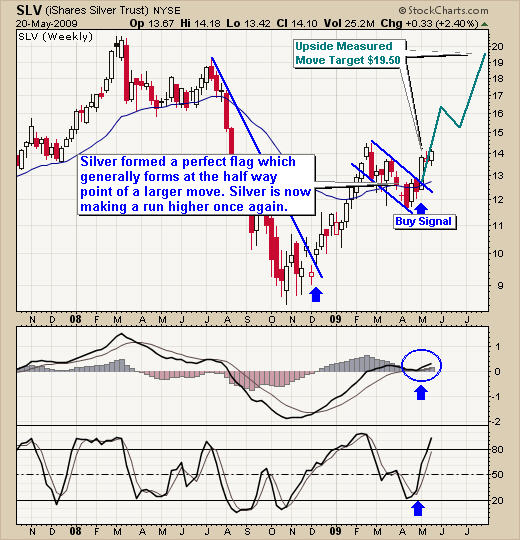
Weekly Silver Active Trading Chart
This chart clearly shows the potential that silver has over the next few months.
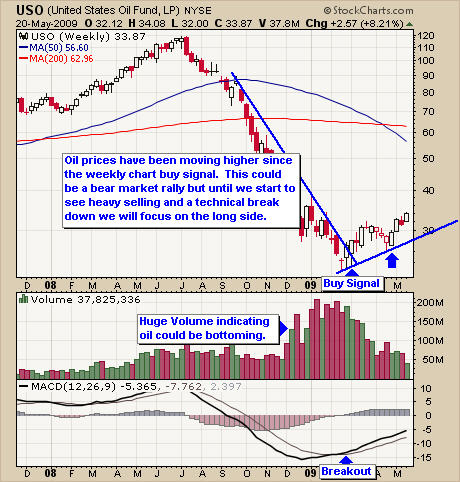
Crude Oil Active Trading - Weekly Chart
Crude oil made a new 6 month high this week. Money has been flowing into commodities the past couple weeks as traders and investors try to protect them selves from the over bought equities market. This weekly chart and really most weekly charts generate clean buy and sell breakout signals.
TheGoldAndOilGuy Trading Conclusion
I think gold and silver will do very well over the next couple weeks. Depending on how strong the pullback is for equities, it will play a roll in the price of precious metals. If we get a really strong reversal and rally then I don't think gold and silver will do as well.
Looking at oil it's more difficult to say what could happen. If the equities market drops fast then I think it will pull oil with it as investors lose confidence and oil demand will continue to decrease.
We have some very exciting opportunities ahead of us and its important that we keep our risk low while taking advantage of current market swings using stocks, ETF's and commodities. My focus is to keep overall risk under 3% for all my trades and to add to winning position and cut losses quickly.

Chris Vermeulen has been involved in the markets since 1997 and is the founder of Technical Traders Ltd. He is an internationally recognized technical analyst, trader, and is the author of the book: 7 Steps to Win With Logic
Through years of research, trading and helping individual traders around the world. He learned that many traders have great trading ideas, but they lack one thing, they struggle to execute trades in a systematic way for consistent results. Chris helps educate traders with a three-hour video course that can change your trading results for the better.
His mission is to help his clients boost their trading performance while reducing market exposure and portfolio volatility.
He is a regular speaker on HoweStreet.com, and the FinancialSurvivorNetwork radio shows. Chris was also featured on the cover of AmalgaTrader Magazine, and contributes articles to several financial hubs like MoneyShow.com.
More from Silver Phoenix 500


