EURUSD and AUDUSD Currency Market Updates


There has been some interesting action take place in both the Aussie Dollar and Euro recently so let’s take a look beginning with the EURUSD daily chart.
EURUSD DAILY CHART
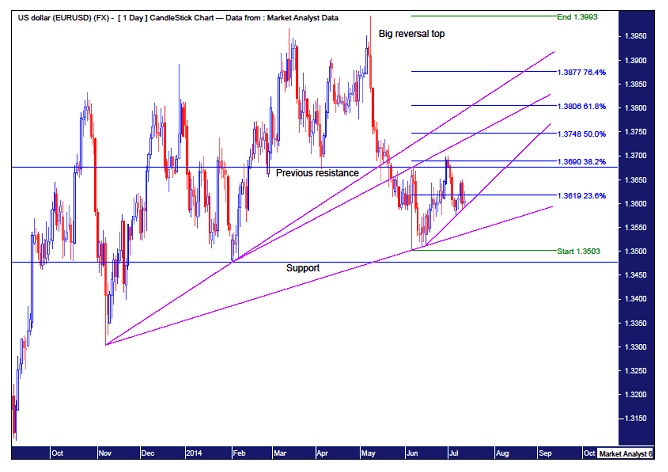
It’s the northbound train! In my previous report I stated that the EURUSD train was set to leave the station and I believed it would be the southbound one. But this doesn’t look like the northbound express. More like the all stops! Previous resistance was at 1.3676 and we can see that right at the end of June price busted this resistance taking at stops that had been building above this level. Once those stops were taken out, price then reversed and is currently around the 1.36 level.
However, I’m not convinced this is the start of a major move up. My previous report include longer term technicals which had a bearish conclusion and I still believe this to be the case. So while the recent breaking of resistance averted the super bearish scenario I still believe a bigger move down is set to take place, just delayed as it appears this rally has further to go.
Another reason I favour that the trend is now down is the big reversal top in place which occurred on 8th May. I like “pop and drop” type tops which is exactly what we have here. The May top at 1.3993 was not only a false break of the March top, it was a big reversal which is a common topping pattern whether on the daily chart or the intraday chart.
I have drawn some Fibonacci retracement levels of the move down from top to recent low. These may help in trying to determine where the rally may eventually end. The recent short covering rally after the bust of resistance stopped around the 38.2% level but I think this is only temporary. Personally I favour more the 61.8% level at 1.3806 but let’s see the pattern of trading as price approaches each new level. The trend lines I have drawn may contain the trading going forward until the rally top is in.
Now let’s move on to the AUDUSD looking at its daily chart.
AUDUSD DAILY CHART
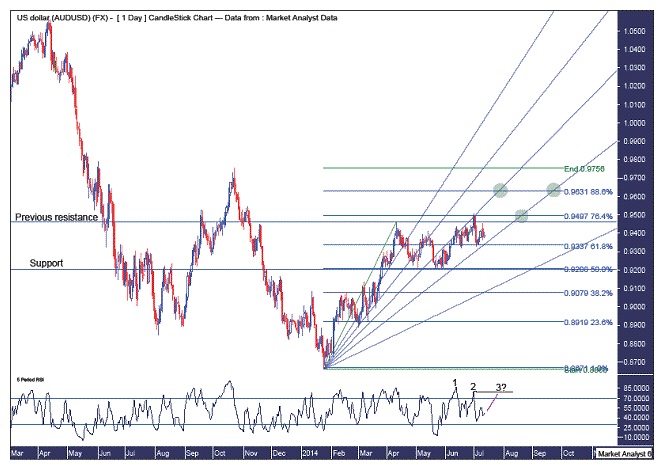
Recently the strong resistance at 94.6c was taken out. Before the break I started seeing this resistance level being talked about quite a lot by chartists, let alone myself. That’s when I started to get the heebie jeebies as it became too obvious. I hate being part of the majority opinion but that’s exactly what happened here. And sure enough price busted the resistance taking out stops above it including mine. Well, I reduced my position when the EURUSD broke its resistance as I knew something wasn’t right and the game was probably up.
Nevertheless, I don’t expect this break to lead to a significant up move. My longer term analysis, as outlined in a previous report, leads me to believe there is lower to go so I continue to watch for evidence of the end of the rally.
Just as occurred in the EURUSD, the busting of resistance in the AUDUSD lead to a short covering rally before turning back down. This little rally was stopped by the 76.4% Fibonacci retracement level of the move down from October 2013 high to January 2014 low. I have also added a Fibonacci Fan and this rally also stopped where the 50% angle intersected with this 76.4% retracement level. Nice.
However, I still expect there is higher to go and I have added another less well known level in the 88.6% level which stands at 96.31c. I have also added green highlighted circles where the Fibonacci fan intersects with some retracement levels. These are potential points for the rally to end.
I have also added a Relative Strength Indicator (RSI) as something to watch for is a triple bearish divergence on the next high. I’m not convinced it will happen but I thought the possibility should be noted.
So, as it stands currently, I’m not involved in either pair, just watching and waiting patiently for the market to reveal it’s hand which is a bit of a paradox given its bias for skulduggery!
More from Silver Phoenix 500


