EUR/USD At Lowest Levels Since Last November


Although the USD Index moved slightly lower earlier today, currency bulls stopped their opponents and pushed the greenback higher once again. As a result, EUR/USD extended losses and dropped to its lowest level since almost a year. How low could the exchange rate go?
In our opinion, the following forex trading positions are justified – summary:
EUR/USD: short (a stop-loss order at 1.1180; downside target at 1.0568)
GBP/USD: none
USD/JPY: none
USD/CAD: none
USD/CHF: long (a stop-loss order at 0.9664; upside target at 1.0237)
AUD/USD: none
EUR/USD
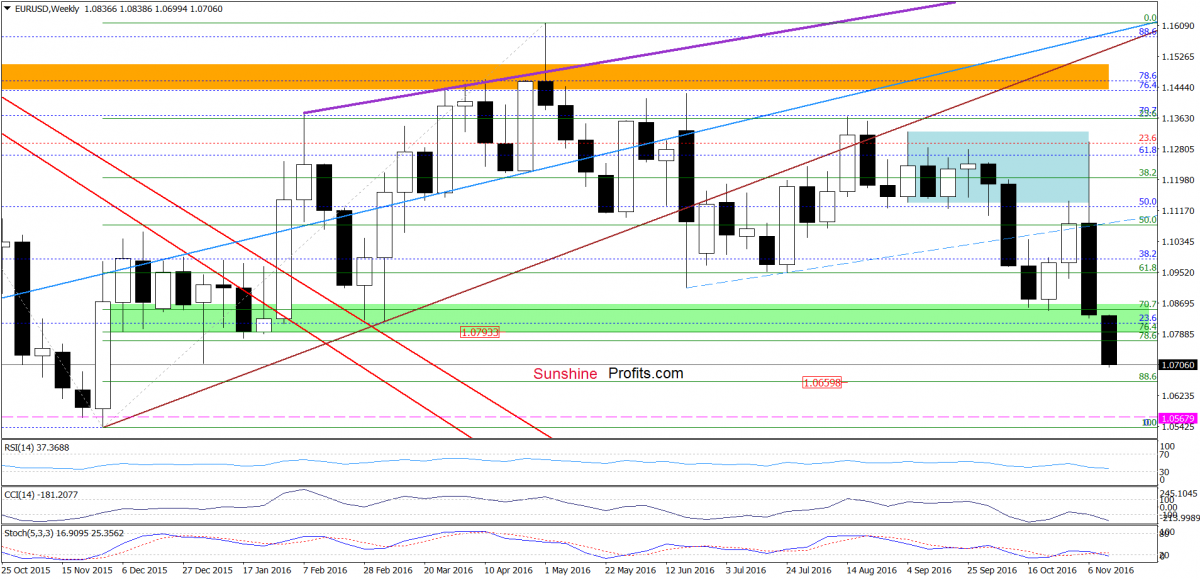
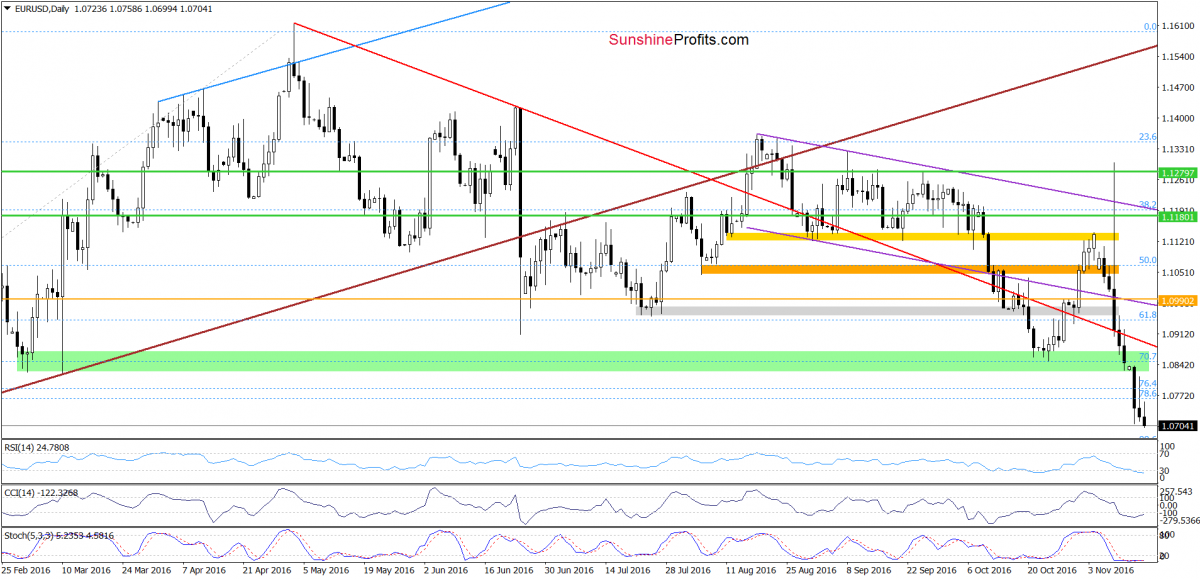
Looking at the above charts, we see that EUR/USD extended losses (making our short positions more profitable), which in combination with a lack of buy signals generated by the indicators suggests that what we wrote yesterday is up-to-date also today:
(...) although EUR/USD moved higher earlier today, currency bulls didn’t manage to push the pair to the green zone (not to mention a breakout above it), which resulted in a reversal and decline. Such price action doesn’t bode well for improvement and means that what we wrote [on Monday] remains up-to-date:
(...) EUR/USD not only slipped to our Friday’s target, but also declined below it (...), which is a negative signal that suggests further deterioration and a test of the 88.6% Fibonacci retracement in the coming day(s).
Very short-term outlook: bearish
Short-term outlook: mixed with bearish bias
MT outlook: mixed
LT outlook: mixed
Trading position (short-term; our opinion): Short (profitable) positions are justified from the risk/reward perspective.
USD/CHF
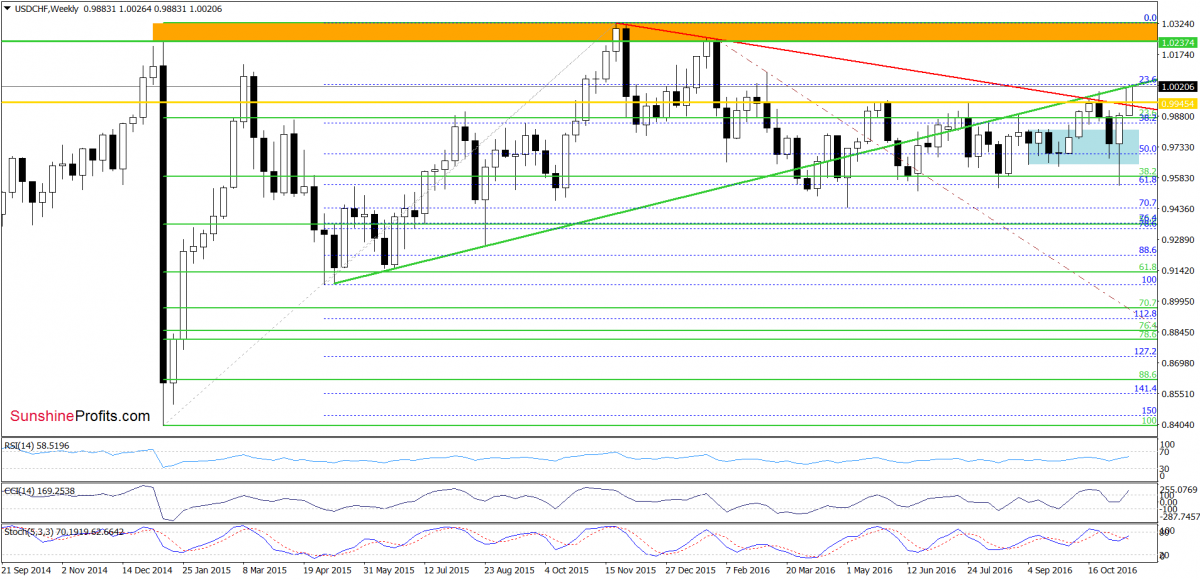
On the weekly chart, we see that USD/CHF extended gains and climbed to the previously-broken green resistance line, which could pause further rally.
But will we see such price action? Let’s examine the daily chart and find out what can we infer from it about future moves?
On Monday, we wrote the following:
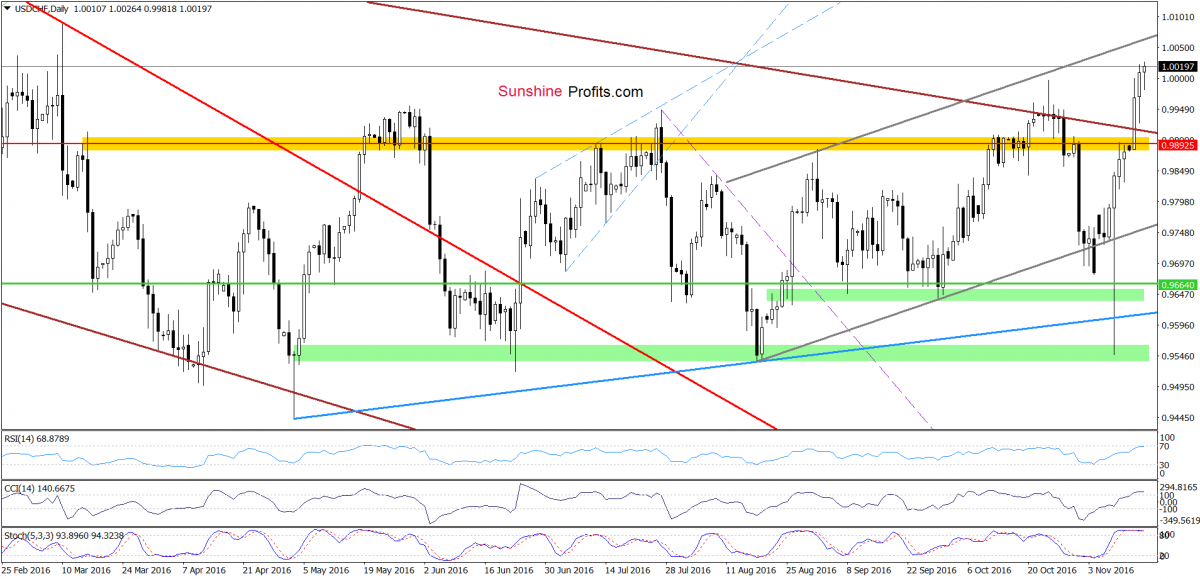
(...) USD/CHF broke not only above the yellow resistance zone (as we had expected), but also moved above the red declining resistance line based on the Nov 2015 and Jan 2016 highs, which is a positive signal that suggests further improvement and a test of the Oct high.
From today’s point of view, we see that the situation developed in line with the above scenario and USD/CHF successfully broke above our upside target. What’s next? Although all indicators increased to their highest levels since late Oct, we think that as long as there are no sell signals generated by the indicators (or other negative developments) another attempt to move higher is likely. If this is the case, our next upside targets from Monday’s alert would be in play:
(...) we may see a rally to around 1.0020 (the previously-broken green line marked on the weekly chart, which serves now as the nearest resistance) or even to 1.0056, where the upper border of the grey rising trend channel (seen on the daily chart) currently is.
Very short-term outlook: bullish
Short-term outlook: mixed with bullish bias
MT outlook: mixed
LT outlook: mixed
Trading position (short-term; our opinion): Long (profitable) positions are justified from the risk/reward perspective.
AUD/USD
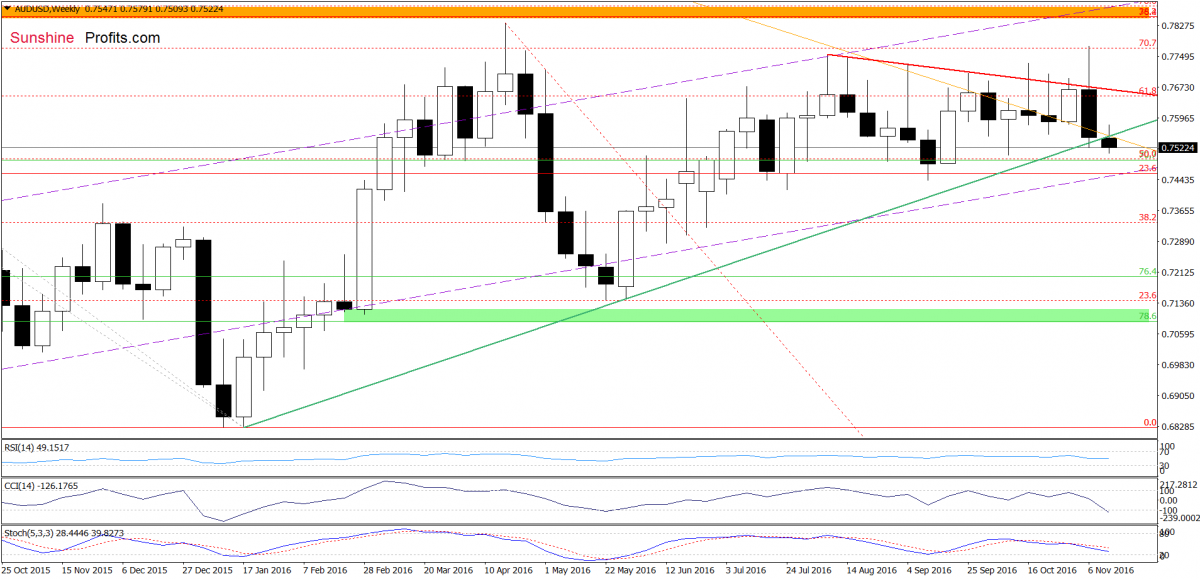
On the weekly chart, we see tat invalidation of the breakout above the red declining resistance line triggered a sharp decline, which took AUD/USD below the green support line. Earlier this week, the pair verified the breakdown, which suggests further deterioration.
How low could the exchange rate go in the coming days? Let’s examine the daily chart and find out.
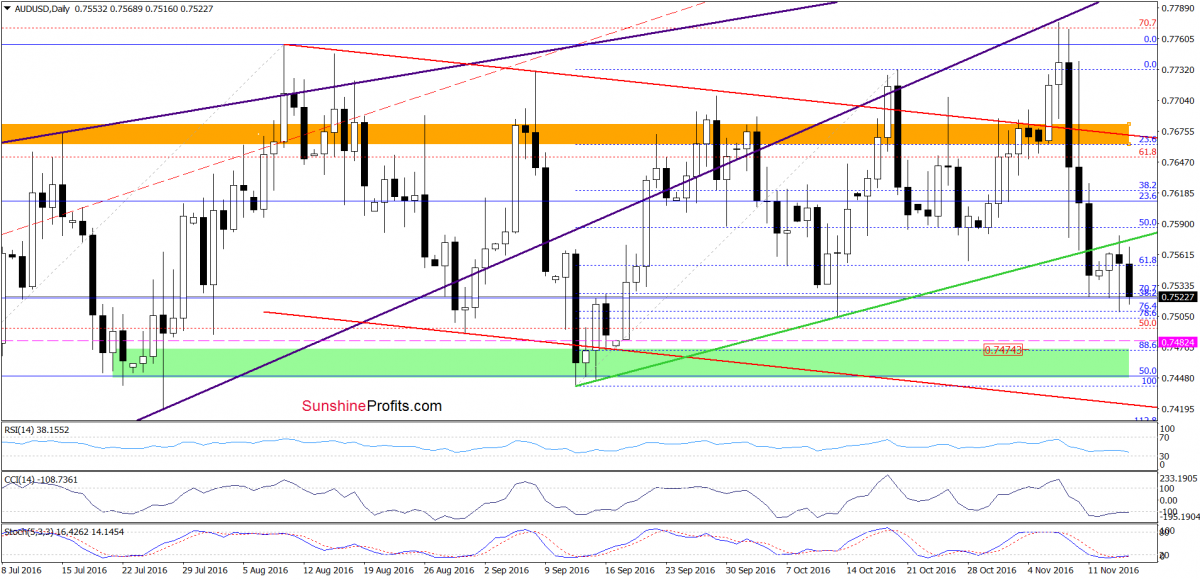
Quoting our Monday’s alert:
(...) the recent sharp downward move took the pair not only under the green line based on the Jan and May lows, but also below the green support line based on the previous lows, which doesn’t bode well for AUD/USD. Additionally, sell signals generated by the indicators remain in place, supporting currency bears and further deterioration.
From today’s point of view, we see that although AUD/USD rebounded yesterday, the previously-broken green line (which serves now as the nearest resistance) stopped currency bulls triggering another pullback earlier today. In this way, the pair verified the breakdown, which suggests that our next downside target from Monday’s alert would be in play in near future:
(...) if the pair declines from here, the initial downside target would be around 0.7474, where the 88.6% Fibonacci retracement (based on the recent upward move) and the green support zone are.
Very short-term outlook: bearish
Short-term outlook: mixed with bearish bias
MT outlook: mixed with bearish bias
LT outlook: mixed
Trading position (short-term; our opinion): No positions are justified from the risk/reward perspective at the moment.
More from Silver Phoenix 500


