Fibonacci Predictive Modeling Suggests Price Volatility Will Continue


We believe price volatility may surprise many traders throughout the end of this year. Our proprietary Fibonacci price modeling system is suggesting that price must rotate dramatically higher or lower to establish any new confirmed price trends. The Fibonacci price modeling system can be particularly useful in determining where and when price may attempt a major future price move. Today, we are sharing both Daily and Weekly chart highlighting our proprietary Fibonacci price modeling system for the ES and YM to help our readers and followers understand what's in store for the US markets over the next few weeks and months.
Much like many of our other proprietary price and predictive modeling systems, the Fibonacci price modeling system adapts to price rotation, trends and volatility automatically by adjusting internal factoring levels and analysis functions to adapt to changes in price range and volatility. The process of adapting in this manner provides us with some very insightful capabilities. Today, we are going to focus on the Daily, the shorter term Fibonacci price analysis, and the Weekly, the longer term Fibonacci price analysis, modeling system results and attempt to share our current expectations with you.
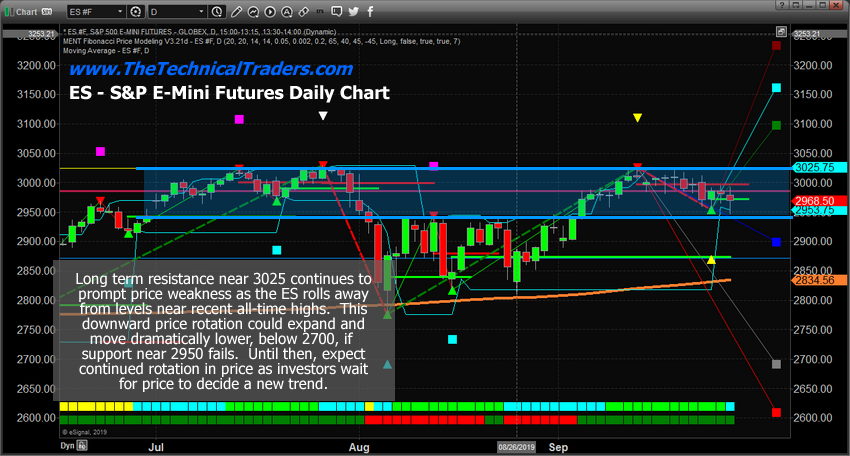
This ES Daily Fibonacci chart prompts two initial analysis insights – first, the peaks near 3025 appear to have setup a double-top pattern that should be interpreted as major resistance. Historical Fibonacci price trigger levels setup a range in price that has proven to be a key price channel (highlighted in LIGHT BLUE). Current price rotation suggests continued price weakness may continue – at least until price attempts to rally above 3025 and attempts to establish a new price high. Downside price targets are near 2900, 2695 and 2610. Rotation within the price channel could continue for a while before a new price trend is established.
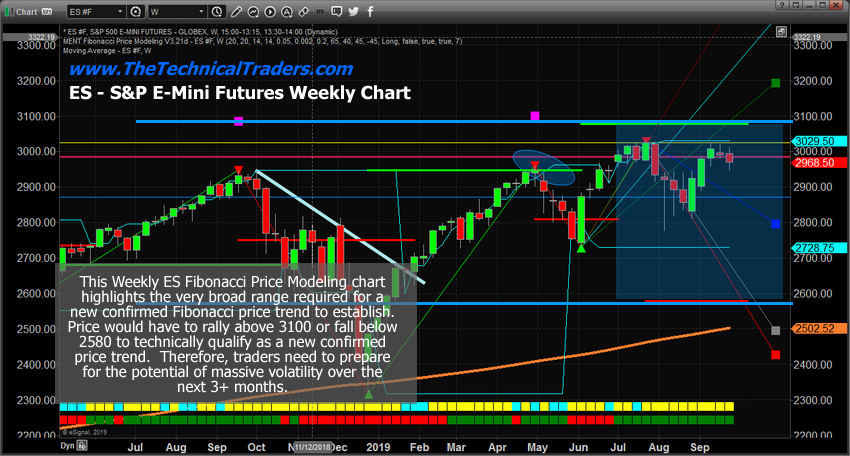
This Weekly ES Fibonacci price chart highlights the very wide Fibonacci price trigger levels that suggest extreme price volatility could become a major factor going forward. The interesting facet of this chart is that Bearish Fibonacci trigger levels have been crossed over the past 12+ months whereas Bullish Fibonacci trigger levels have stayed just outside of real price levels. This suggests that the current upside price move, over the past 7+ months, could be a pullback in a bearish price trend. As difficult as that may be for some traders to understand at this point, the process of the Fibonacci price modeling system that adapts to price trend and rotation is designed to allow for price to determine future outcomes. Thus, the Bullish trigger levels being far outside the upside price peaks suggests that price may be moving higher within a defined downtrend cycle – a pullback within a bearish trend.
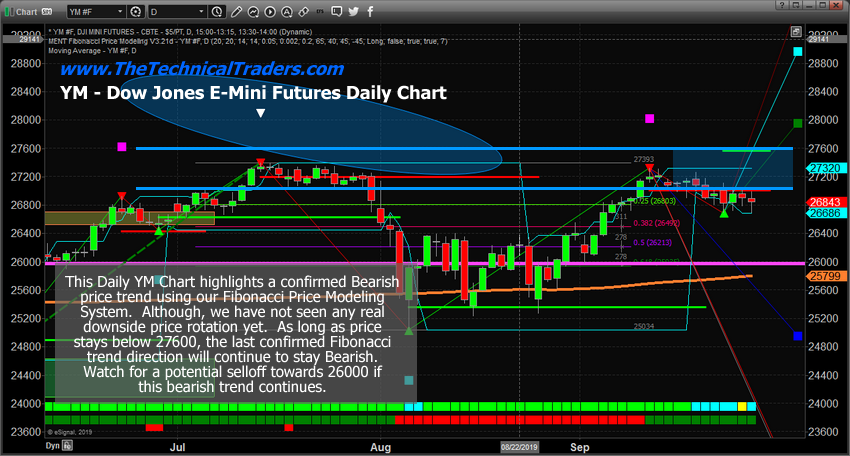
This Daily YM chart is setup very similar to the ES Daily chart with a defined price channel established by the current Fibonacci price trigger levels (highlighted in LIGHT BLUE on this chart). The lower price peak recently, near September 11, suggests price was unable to rally back to near previous high levels. Technical, this can be interpreted as a Double-top and can also be interpreted as a failure to attempt to rally above 27500. We believe the current rotation is indicative of a channel consolidation before a breakout/breakdown move.
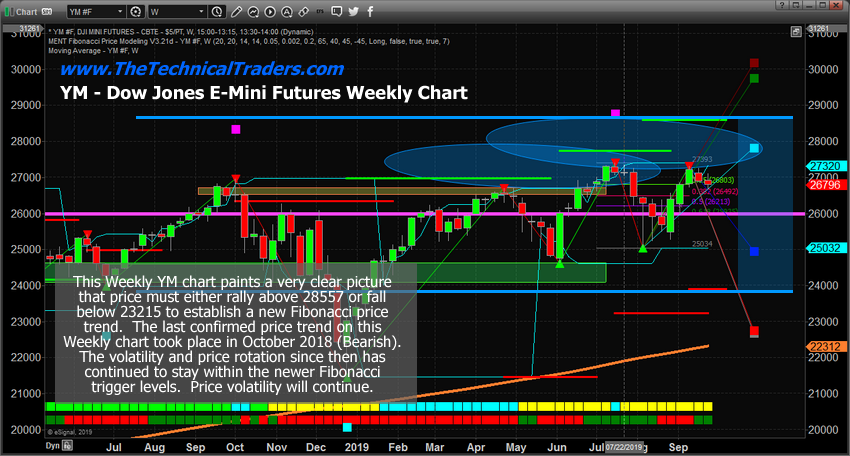
This Weekly YM chart highlights the extended range between the Fibonacci price trigger levels and suggests the YM is setting up a bigger move in the near future. Just like the ES chart, the YM is showing that price is stuck within a channel and that the Fibonacci price modeling system is suggesting a breakout or breakdown move is likely. At these times, we would fall back to the Daily charts for the shorter term analysis which suggests sideways trading within a range and the potential that the bearish price trend is the more dominant bias.
We believe the US stock market could be setting up for a downside price rotation that may become very volatile over the next 2 to 3 months. Price would have to break below recent price troughs before we could attempt to establish any new longer-term price trends. The recent price rotation, higher highs, and higher lows, is indicative of a bullish price trend. Although, we believe this trend may be a technical pullback of a bearish price trend.
Ultimately, price will dictate a new price trend and extended direction. We believe any price rotation (downward) will be fairly short lived and setup a new upside price rally that will attempt to rally beyond recent price highs. Skilled technical traders need to be prepared for extended volatility over the next 30 to 60+ days and be prepared for some big price trends.
MORE CRUCIAL WARNING SIGNS ABOUT THE US MARKETS TOPPING AND THE GOLD AND SILVER BULL MARKET
In early June I posted a detailed video explaining in showing the bottoming formation and gold and where to spot the breakout level, I also talked about crude oil reaching it upside target after a double bottom, and I called short term top in the SP 500 index. This was one of my premarket videos for members it gives you a good taste of what you can expect each and every morning before the Opening Bell. Watch Video Here.
I then posted a detailed report talking about where the next bull and bear markets are and how to identify them. This report focused mainly on the SP 500 index and the gold miners index. My charts compared the 2008 market top and bear market along with the 2019 market prices today. See Comparison Charts Here.
On June 26th I posted that silver was likely to pause for a week or two before it took another run up on June 26. This played out perfectly as well and silver is now head up to our first key price target of $17. See Silver Price And Analysis ( https://www.silver-phoenix500.com/article/silver-will-pause-another-move-higher-begins ) .
More recently on July 16th, I warned that the next financial crisis (bear market) was scary close, possibly just a couple weeks away. The charts I posted will make you really start to worry. See Scary Bear Market Setup Charts.
CONCLUDING THOUGHTS
In short, you should be starting to get a feel of where stocks are headed along with precious metals for the next 8-24 months. The next step is knowing when and what to buy and sell as these turning points take place, and this is the hard part. If you want someone to guide you through the next 12-24 months complete with detailed market analysis and trade alerts (entry, targets and exit price levels) join my ETF Trading Newsletter.
Be prepared for these incredible price swings before they happen and learn how you can identify and trade these fantastic trading opportunities in 2019, 2020, and beyond with our Wealth Building & Global Financial Reset Newsletter. You won’t want to miss this big move, folks. As you can see from our research, everything has been setting up for this move for many months.
Join me with a 1 or 2-year subscription to lock in the lowest rate possible and ride my coattails as I navigate these financial market and build wealth while others lose nearly everything they own during the next financial crisis.
As a technical analysis and trader since 1997, I have been through a few bull/bear market cycles. I believe I have a good pulse on the market and timing key turning points for both short-term swing trading and long-term investment capital. The opportunities starting to present themselves will be life-changing if handled properly.
FREE GOLD OR SILVER WITH MEMBERSHIP!

Kill two birds with one stone and subscribe for two years to get your FREE PRECIOUS METAL and get enough trades to profit through the next metals bull market and financial crisis!
Chris Vermeulen – www.TheTechnicalTraders.com
NOTICE: Our free research does not constitute a trade recommendation, or solicitation for our readers to take any action regarding this research. It is provided for educational purposes only. Our research team produces these research articles to share information with our followers/readers in an effort to try to keep you well informed. Visit our web site (www.thetechnicaltraders.com) to learn how to take advantage of our members-only research and trading signals.
********

Chris Vermeulen has been involved in the markets since 1997 and is the founder of Technical Traders Ltd. He is an internationally recognized technical analyst, trader, and is the author of the book: 7 Steps to Win With Logic
Through years of research, trading and helping individual traders around the world. He learned that many traders have great trading ideas, but they lack one thing, they struggle to execute trades in a systematic way for consistent results. Chris helps educate traders with a three-hour video course that can change your trading results for the better.
His mission is to help his clients boost their trading performance while reducing market exposure and portfolio volatility.
He is a regular speaker on HoweStreet.com, and the FinancialSurvivorNetwork radio shows. Chris was also featured on the cover of AmalgaTrader Magazine, and contributes articles to several financial hubs like MoneyShow.com.
More from Silver Phoenix 500


