Flying High in the Sky…Looking For Opportunities In 2015


 It’s the start of a new year, meaning it’s also time to give your investment strategy a tune up and ensure that its engine is running optimally and ready for takeoff. Soaring at 500 miles per hour and looking down from 40,000 feet at your portfolio, you can more easily visualize where you need to diversify and rebalance.
There may be no one more qualified to help guide you in this exercise than investor behaviorist and asset allocation guru Roger Gibson.
Some of you might have heard of or read the work of Gibson, whose seminal piece, “The Rewards of Multiple-Asset-Class Investing,” is still often cited as one of the best sources on the subject of building a killer portfolio. Though originally published in 1998, its main thesis—that a portfolio made up of multiple asset classes to minimize volatility and capture risk-adjusted reward—is as relevant today as it was 17 years ago.
Before I deep dive into the minutiae of Gibson’s piece, I want to share with you a chart last seen in an early December Frank Talk.
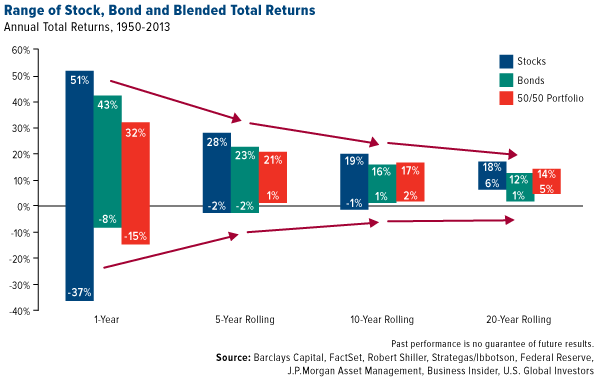
Using data collected between 1950 and 2013, we can see that the returns of a portfolio composed strictly of stocks have greatly outperformed those of bonds and a blended portfolio in the short term, or one-year period. The risks, on the other hand, have also far exceeded the other two scenarios, by a spread of at least 22 percentage points: stocks’ -37 percent versus a blended portfolio’s -15 percent.
 But when blended portfolios were held for five, 10 and 20 years, they began to do two curious things: 1) they gradually outperformed bonds, and 2) they demonstrated less risk than stocks. In other words, it smoothed out the ride and prevented hitting turbulence along the way.
That’s why savvy investors know to be patient with their holdings and not easily give in to the prevailing culture of instant gratification. I’ve run multiple marathons over the years and am intimately familiar with the personal rewards of going the distance. A similar investing strategy can come with the same rewards.
The chart shown above illustrates what Gibson asserts early on in “Multiple-Asset-Class Investing”:
When we construct an investment portfolio using multiple asset classes, we discover that portfolio volatility is less than the weighted average of the volatility levels of its components.
In other words, stocks and bonds both have their own unique DNA of volatility, but when equally combined, the two have tended to balance each other out favorably.
As Gibson colorfully puts it:
The multiple-asset class strategy is a tortoise-and-hare story. Over any one-year, three-year or ten-year period, the race will probably be led by one of the component single-asset classes. The leader will, of course, attract the attention. The tortoise never runs as fast as many of the hares around it. But it does run faster on average than the majority of its components, a fact that becomes lost due to the attention-getting pace of different lead rabbits during various legs of the race…
Yet the tortoise, in the long run, leaves the pack behind.
 And in case the analogy was lost on anyone, the hare is the single-asset-class—domestic stocks, for instance—whereas the multiple-asset-class is the tortoise.
This is precisely the point I make in my story, “A Little Pillow Talk Turned Her Husband on to Bonds.” To give you the Cliff Notes version, Karen, 64 years old and retired, convinces her husband George, 67, to allocate half of their retirement portfolio to domestic stocks, the other half to bonds. As a result:
What would have been restless nights for George through [the early 2000s] were moderated by the effect of the short-term muni fund Karen chose. And the great leaps in the S&P 500 that Karen would have missed out on were captured by her husband’s 50-percent allocation.
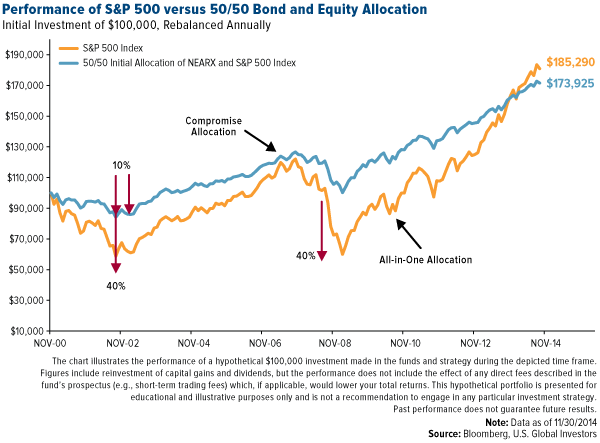
This hypothetical portfolio illustrates how diversifying into even just two asset classes—our Near-Term Tax Free Fund (NEARX) and an S&P 500 index fund, for instance—can result in less volatility. We can’t guarantee how our fund will perform in the future, but NEARX has historically shown an ability to dodge the dramatic swings and volatility in the equity market, similar to the ones we experienced during the first decade of the century. Of course there will be times when equities like an S&P 500 index fund will strongly outperform the 50/50 allocation to the S&P and NEARX combo, but George and Karen’s story is one example of how these two investment strategies have previously performed.
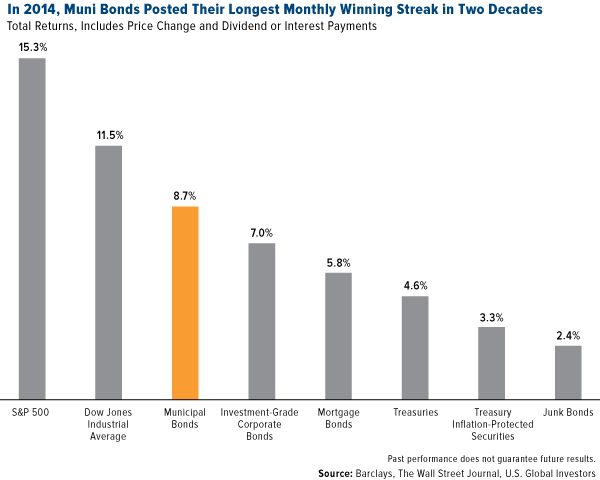
And speaking of municipal bonds, the Wall Street Journal reports that they’ve had their best year in approximately two decades, posting their “longest string of monthly gains” and “outpacing gains in corporate bonds and U.S. government debt.”
The Journal writes:
Investors are flocking to the $3.6 trillion municipal bond market at a time of low interest rates, uneven global growth and concern that the nearly uninterrupted rise in many stocks and bonds since the financial crisis will come to an end. The debt is especially attractive because interest payments typically don’t generate federal taxes and, in some cases, aren’t subject to state taxes.
Multiple Asset Classes and the Magic of Mean Reversion
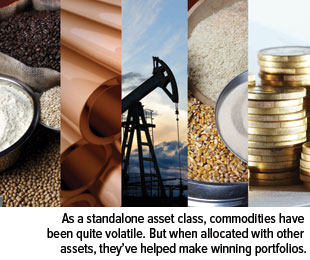
The graph below, taken from Roger Gibson’s own research, is the result of tracking nearly 40 years’ worth of market data. He looked specifically at four asset classes: U.S. stocks, foreign stocks, commodities and real estate securities. He then examined what happened if you steadily blended these equities.
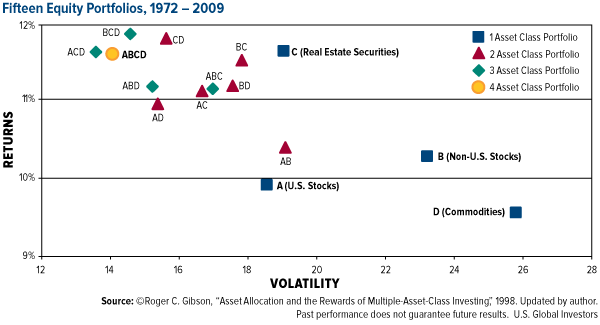
You can see the historical risks and rewards of 15 different types of equity portfolios Gibson assembled—four composed of a single asset (the blue squares), six composed of two assets (the red triangles), four of three assets (the green diamonds) and one containing all four assets (the yellow circle).
 With one exception—real estate securities (C)—the portfolios that contained only one type of asset class tended to offer the least amount of annualized returns and pose the greatest volatility. When you blended the equities—two at a time, three at a time and then all four—both the returns and standard deviations improved. The yellow circle (ABCD), which makes use of all four asset classes, ranked as one of the least volatile, most rewarding portfolios.
What’s amazing is that the most volatile asset class, commodities (D), helped constitute the very top-performing portfolios: ACD, BCD, CD and ABCD. Again, this demonstrates Gibson’s point that “portfolio volatility is less than the weighted average of the volatility levels of its components.”
Or put another way:
For investors concerned primarily with maximizing portfolio returns, we see that multiple asset-class strategies have dominated single-asset-class strategies.
Just as you must have discipline to pace yourself and complete a marathon, it takes discipline to regulate and manage your emotions while rebalancing your portfolio. It only makes sense to pivot into asset classes that are reverting to their mean in order to catch the upside. This is a subject I touch upon in my whitepaper, “Managing Expectations.”
The Case for Active Management and Contrarian Investing
One final point I want to make involves active management. You might have heard that investors are increasingly placing their money in exchange-traded funds (ETFs), which in many cases have delivered excellent returns. But a recent piece in InvestmentNews makes the case that active management, such as what we use for our mutual funds, is indispensable going into 2015.
We’ve experienced an equity bull run for half a decade now, so it’s easy to presume that an index fund will be able to catch all the upside. But what about the downside? A correction is likely to occur at some point. As opposed to an index fund, active management helps to curtail volatility, such as what we’ve seen lately in certain sectors such as commodities and emerging markets, and mitigate risk.
“The idea is there will be benefits of investing with active managers as we get along in the market cycle and the possibility of downturn seems stronger,” says John Rekenthaler, vice president at Morningstar.
A perfect example of this is our exit from Russia. The benchmark of our Emerging Europe Fund (EUROX), the MSCI Emerging Markets Europe 10/40 Index, maintains a 46-percent weighting in Russia. But because of prudent active management, we were able to divest out of Russia and avoid many of the downturns incurred by international sanctions, falling oil prices and a weakening ruble.
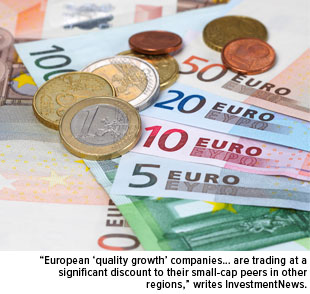 The European slowdown has received much attention, in my own blog and elsewhere, but there are still plenty of investment opportunities. Another recent piece by InvestmentNews, in fact, finds that “European ‘quality growth’ companies, which include euro-area and non-euro-area firms, are trading at a significant discount to their small-cap peers in other regions.” Additionally, the writers’ analysis “suggests that European companies have the most potential to improve returns… as a more sustainable European recovery takes hold.”
Indeed, several European businesses are making admirable strides. Names we own that pay a dividend include Italy’s UniCredit and Brembo and Switzerland’s Straumann Holdings. Poland has also been good to the fund. For 2014, Energa SA had a 12-month dividend yield of 4.3 percent; PKO Bank Polski, 2.1 percent; and insurer PZU Group, 7.05 percent.
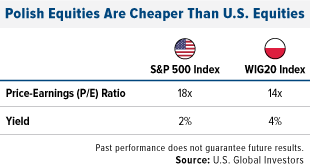 Take a look at the chart to the right. What it shows is that Polish equities, indicated by the WIG20 Index, are not only cheaper than U.S. equities right now—by nearly a quarter percent—but they also pay out twice the dividend yield. Simply put, you’re getting more for less.
Additionally, Tom McClellan, editor of the McClellan Market Report, offers three clues as to why the “Euro Is Ripe for an Upturn,” one of which is that:
The beginning of a new calendar year usually sees some kind of reversal of the existing trend in the euro… The February 1, 2013 top was a much later than normal manifestation of this behavior; usually the reversal is closer to New Year’s Day.
Keeping It Diversified
You might wonder if Roger Gibson’s research still holds up after all these years, especially following the market meltdown that was the Great Recession. As recently as two years ago, Forbes contributor Gregg S. Fisher revisited the multiple-asset-class investing strategy with fresh data and found that it indeed still makes for a souped-up portfolio.
“In an industry prone to fads,” Fisher writes, “thoughtful portfolio diversification is an investment strategy that stands the test of time.”
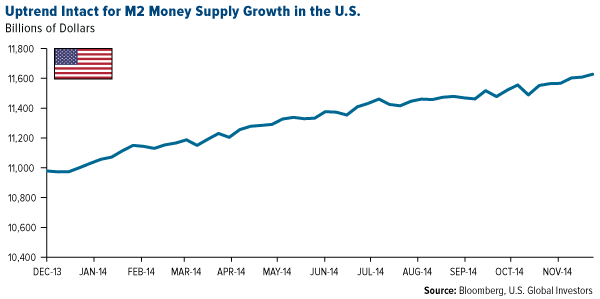
The good news is that highly-liquid M2 money supply growth has quickened, up around 5 percent from a year ago. Historical trends have shown that rising money supply has been good for stocks.
Now’s the time to rebalance and ignite your portfolio’s jet thrusters. Let’s make 2015 a prosperous year!
If you aren’t already a subscriber to our Investor Alert newsletter, stay informed on weekly market movers and sign up today!
Please consider carefully a fund’s investment objectives, risks, charges and expenses. For this and other important information, obtain a fund prospectus by visiting www.usfunds.com or by calling 1-800-US-FUNDS (1-800-873-8637). Read it carefully before investing. Distributed by U.S. Global Brokerage, Inc.
Past performance does not guarantee future results.
Total Annualized Returns as of 9/30/2014
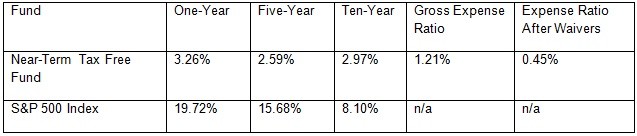
Expense ratio as stated in the most recent prospectus. The expense ratio after waivers is a contractual limit through December 31, 2015, for the Near-Term Tax Free Fund, on total fund operating expenses (exclusive of acquired fund fees and expenses, extraordinary expenses, taxes, brokerage commissions and interest). Performance data quoted above is historical. Past performance is no guarantee of future results. Results reflect the reinvestment of dividends and other earnings. For a portion of periods, the fund had expense limitations, without which returns would have been lower. Current performance may be higher or lower than the performance data quoted. The principal value and investment return of an investment will fluctuate so that your shares, when redeemed, may be worth more or less than their original cost. Performance does not include the effect of any direct fees described in the fund’s prospectus which, if applicable, would lower your total returns. Performance quoted for periods of one year or less is cumulative and not annualized. Obtain performance data current to the most recent month-end at www.usfunds.com or 1-800-US-FUNDS.
Bond funds are subject to interest-rate risk; their value declines as interest rates rise. Though the Near-Term Tax Free Fund seeks minimal fluctuations in share price, it is subject to the risk that the credit quality of a portfolio holding could decline, as well as risk related to changes in the economic conditions of a state, region or issuer. These risks could cause the fund’s share price to decline. Tax-exempt income is federal income tax free. A portion of this income may be subject to state and local taxes and at times the alternative minimum tax. The Near-Term Tax Free Fund may invest up to 20% of its assets in securities that pay taxable interest. Income or fund distributions attributable to capital gains are usually subject to both state and federal income taxes.
Foreign and emerging market investing involves special risks such as currency fluctuation and less public disclosure, as well as economic and political risk. By investing in a specific geographic region, a regional fund’s returns and share price may be more volatile than those of a less concentrated portfolio. The Emerging Europe Fund invests more than 25% of its investments in companies principally engaged in the oil & gas or banking industries. The risk of concentrating investments in this group of industries will make the fund more susceptible to risk in these industries than funds which do not concentrate their investments in an industry and may make the fund’s performance more volatile.
The S&P 500 Stock Index is a widely recognized capitalization-weighted index of 500 common stock prices in U.S. companies.
The Dow Jones Industrial Average is a price-weighted average of 30 blue chip stocks that are generally leaders in their industry.
The WIG20 Index is a modified capitalization-weighted index of 20 Polish stocks which as listed on the main market. The index is the underlying instrument for futures transactions listed on the Warsaw Stock Exchange.
The MSCI Emerging Markets Europe 10/40 Index (Net Total Return) is a free float-adjusted market capitalization index that is designed to measure equity performance in the emerging market countries of Europe (Czech Republic, Greece, Hungary, Poland, Russia, and Turkey). The index is calculated on a net return basis (i.e., reflects the minimum possible dividend reinvestment after deduction of the maximum rate withholding tax). The index is periodically rebalanced relative to the constituents' weights in the parent index.
Investing in real estate securities involves risks including the potential loss of principal resulting from changes in property value, interest rates, taxes and changes in regulatory requirements.
There is no guarantee that the issuers of any securities will declare dividends in the future or that, if declared, will remain at current levels or increase over time.
Standard deviation is a measure of the dispersion of a set of data from its mean. The more spread apart the data, the higher the deviation. Standard deviation is also known as historical volatility.
Diversification does not protect an investor from market risks and does not assure a profit.
M2 Money Supply is a broad measure of money supply that includes M1 in addition to all time-related deposits, savings deposits, and non-institutional money-market funds.
Fund portfolios are actively managed, and holdings may change daily. Holdings are reported as of the most recent quarter-end. Holdings in the Near-Term Tax Free Fund, Emerging Europe Fund as a percentage of net assets as of 9/30/2014: Brembo SpA 1.16% Emerging Europe Fund, Energa SA 2.99% Emerging Europe Fund, Powszechna Kasa Oszczednosci Bank Polski SA 4.58% Emerging Europe Fund, Powszechny Zaklad Ubezpieczen SA 3.08% Emerging Europe Fund, Straumann Holdings 1.34% Emerging Europe Fund, UniCredit SpA 2.22% Emerging Europe Fund,.
All opinions expressed and data provided are subject to change without notice. Some of these opinions may not be appropriate to every investor. By clicking the link(s) above, you will be directed to a third-party website(s). U.S. Global Investors does not endorse all information supplied by this/these website(s) and is not responsible for its/their content.
********
Courtesy of http://www.usfunds.com
 Frank Holmes is the CEO and Chief Investment Officer of U.S. Global Investors. Mr. Holmes purchased a controlling interest in U.S. Global Investors in 1989 and became the firm’s chief investment officer in 1999. Under his guidance, the company’s funds have received numerous awards and honors including more than two dozen Lipper Fund Awards and certificates. In 2006, Mr. Holmes was selected mining fund manager of the year by the Mining Journal. He is also the co-author of “The Goldwatcher: Demystifying Gold Investing.” Mr. Holmes is engaged in a number of international philanthropies. He is a member of the President’s Circle and on the investment committee of the International Crisis Group, which works to resolve conflict around the world. He is also an advisor to the William J. Clinton Foundation on sustainable development in countries with resource-based economies. Mr. Holmes is a native of Toronto and is a graduate of the University of Western Ontario with a bachelor’s degree in economics. He is a former president and chairman of the Toronto Society of the Investment Dealers Association. Mr. Holmes is a much-sought-after keynote speaker at national and international investment conferences. He is also a regular commentator on the financial television networks CNBC, Bloomberg and Fox Business, and has been profiled by Fortune, Barron’s, The Financial Times and other publications. Visit the U.S. Global Investors website at http://www.usfunds.com.
More from Silver Phoenix 500


