Gold And Silver In Constant 1920 Dollars


I made charts for gold and silver priced in constant 1920 dollars I thought my readers would find interesting. The plots’ prices are ratios with the nominal dollar price of the metals for the numerators and the indexed increases in Currency in Circulation (CinC) in the denominators. There were two periods in the data where the nominal dollar price of gold was fixed by law:
1920-34: $20.67
1934-68: $35.00
Any change in the price of gold in the chart below during these times when the price of gold was fixed is due to a change in CinC, which during the 1920s the US paper money supply actually saw a DECREASE in CinC, causing gold to increase to $25 from $20.67 in constant 1920 dollar terms. US CinC DECREASED from 4.48 billion paper dollars in January 1920 to 3.73 billion in December 1930. Since then, inflationary increases in CinC in good times and bad has been the policy of US monetary authorities.
Note the 1934 jump in the price of gold, this was due to President Roosevelt devaluing gold from $20.67 to $35 an ounce. This was a 70% devaluation in terms of gold for everyone who owned US paper money, if not in actual market prices from 1934 to 1935. But with time, US monetary inflationary action did ultimately end the 25 cent breakfast of two eggs, bacon, toast and coffee, and cause the paper US $20 bill, which during the 1920s could be exchanged for a US $20 double eagle gold coin in a bank, to lose most of its purchasing power. In August 2011, it took 95, or more paper $20 bills to purchase a single $20 double eagle in a coin shop. This is serious inflation by Washington that continues to this day.
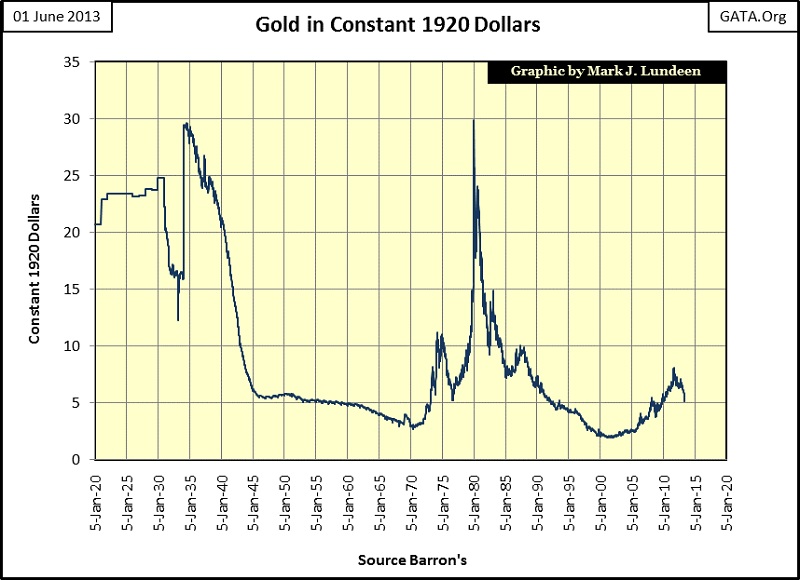
It’s interesting to note that gold priced in constant 1920 dollars twice peaked at around $30 in 1934 and again at the January 1980 gold bull market top. We also see two sub $5 bottoms, where in 1970 gold declined to $3.09 in constant 1920 dollars, and again in 2001 where gold declined to $1.97 in constant 1920 dollar terms. Both sub $5 gold prices eras in the chart proved to be bear market hard bottoms, which was followed by bull markets in the price of gold in both nominal and 1920s dollar terms. Unlike the stock market, gold bull markets see the price of gold increased greater than the increase in paper dollars placed into circulation by the Federal Reserve and the US Treasury. This means real after inflation profits were made from 1968 to 1980, and are again since 2001! Question: will the price of gold once again increase to $30 in constant 1920 terms? I believe it will. Today it would take a gold market price of $8,000 to raise this plot back up to $30 in 1920 terms, where it was in January 1980.
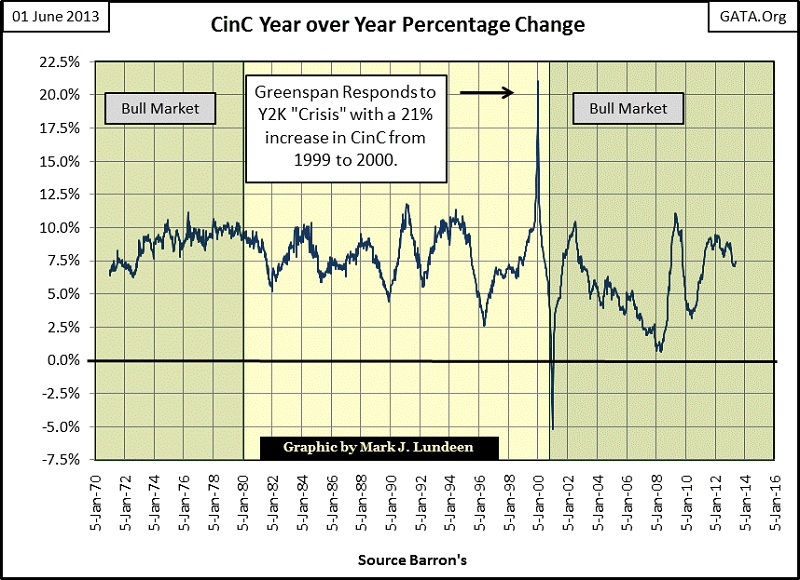
How likely is that? Very likely when we look at the annual increase in the quantity of new US paper currency issued into circulation in the chart below. And this is just for paper money in circulation. When we consider the vast number of digital dollars being created by the FOMC, and the tremendous wealth currently being warehoused in the global debt markets, there are plenty of dollars, yen, and euros that will one day be looking for a safe harbor in a deflationary crisis (declining financial asset valuations); $8,000 should be considered a minimum. I’ve said in the past that gold will one day go for $30,000, if someone on that unknown day with $30K can find someone else foolish enough to exchange an ounce of gold for it. I’m counting on Doctor Bernanke not making me a liar on this, and I’m sure he won’t let me down.
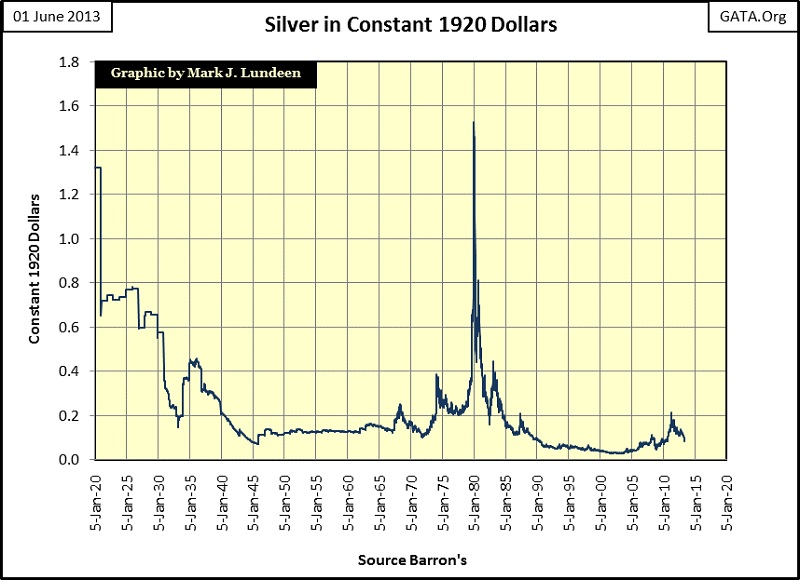
Here is silver in constant 1920 dollar terms. To bring silver up to its January 1980 bull market highs, in constant 1920s terms, silver would have to increase to $450 an ounce. That is an increase of about 20 times, as compared to gold’s gain of a factor of 5.7 times to return it to its 1980’s high in constant 1920 dollar terms. Well, if you want to make the big money in a gold bull market, buy silver!
Seeing both gold and silver return to their 1980 high in constant 1920 dollar terms would see the silver to gold ratio (SGR) decrease to 18 from its current 62. In 1980 the SGR saw 15. A 15 in this model would raise the price of silver up to $533. But since 1980, the amount of gold held above ground has doubled as the supply of silver has actually decreased dramatically, as silver is also an industrial metal that is seldom recycled and so lost to the economy. I expect to see the SGR decline below 10 before this bull market in gold and silver are over, as silver in 2013 is now actually rarer than gold, and more important to the global economy. If scarcity and demand are ever fully priced into silver, we may one day actually see silver priced above gold.
All of these assumptions are based on the US government maintaining its CinC at its current 1.19 Trillion dollars (remember, CinC was 3.73 billion dollars in 1930!), but Doctor Bernanke is now monetizing 85 billion dollars a month to “stabilize” the stock and bond markets and to promote economic “growth.” He claims he wants to stop his QE program, but in fact he knows he is riding on the back of a hungry tiger who would consume a large percentage of the market capitalization currently enjoyed by the bond and stock market (and his banking system’s reserve base) should Doctor Bernanke refuse to feed him. In the choice between continuing to feed his inflationary tiger or finally face the deflationary Mr Bear, the good Doctor will continue feeding his tiger with ever increasing sums of inflationary dollars. So it’s safe to assume that ultimately we will see gold and silver prices much higher than anything I’ve speculated above, with their most massive dollar price moves coming with the end of the US dollar reserve era – which seems to be the exit strategy of choice for the Federal Reserve’s QE program.
More from Silver Phoenix 500


