Gold And Silver: Gold Price Breaks Up As Silver Price Licks Wounds
 share
share
 share
share
 share
share
 share
share
 share
share
The broad weakness of the US dollar supported precious metals and currencies. Gold has been saved from silver's Flash Crash destiny so far. Below are the updated charts for gold and silver.
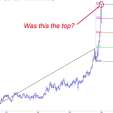
Chart 1. Gold Daily: Breaking Upside
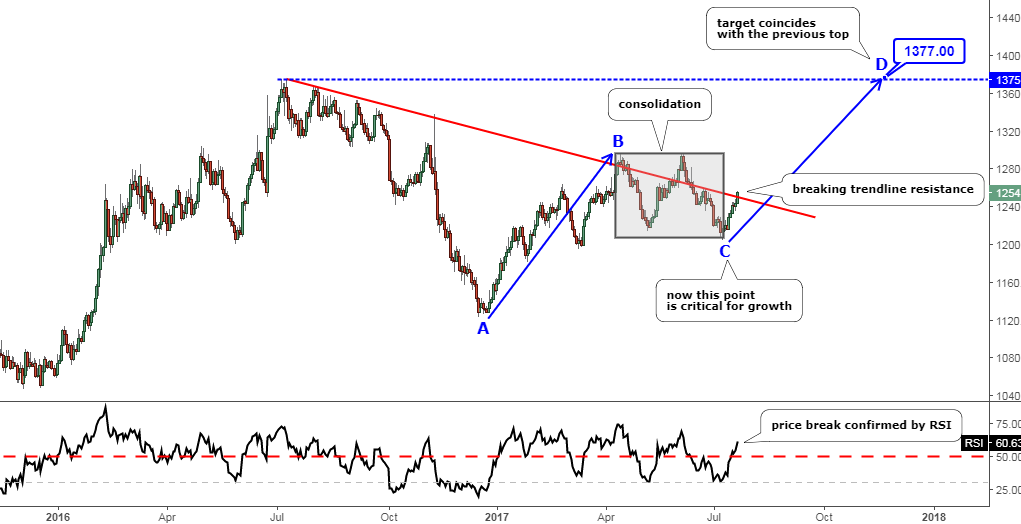
Chart courtesy of tradingview.com
The experimental clone chart for gold that I posted in April amazingly finished its move down as planned although later than expected. The anticipated reverse to the upside followed the end of the consolidation highlighted with the gray rectangle.
The Friday candle had been breaking above the red trendline resistance that last appeared in my March post. This significant price action was supported by the RSI moving above the 50 level.
I labeled the move before the consolidation as the AB segment, which has a distance of $173. The point at the end of the consolidation established at the $1204 mark is now the starting point of the CD segment. It’s now crucial for the gold to keep above this level for the growth structure to be valid.
The conservative target for the CD segment is located at the $1377 mark (CD=AB). Amazingly it coincides with the previous top level at the $1375 mark. But we should bear in mind that the CD segment could imply the Fibonacci ratio beyond the par to bring the price above $1400, and the chart structure is solid enough for it. Let’s wait and see further gold price action.
Chart 2. Silver Daily: Approaching Resistance
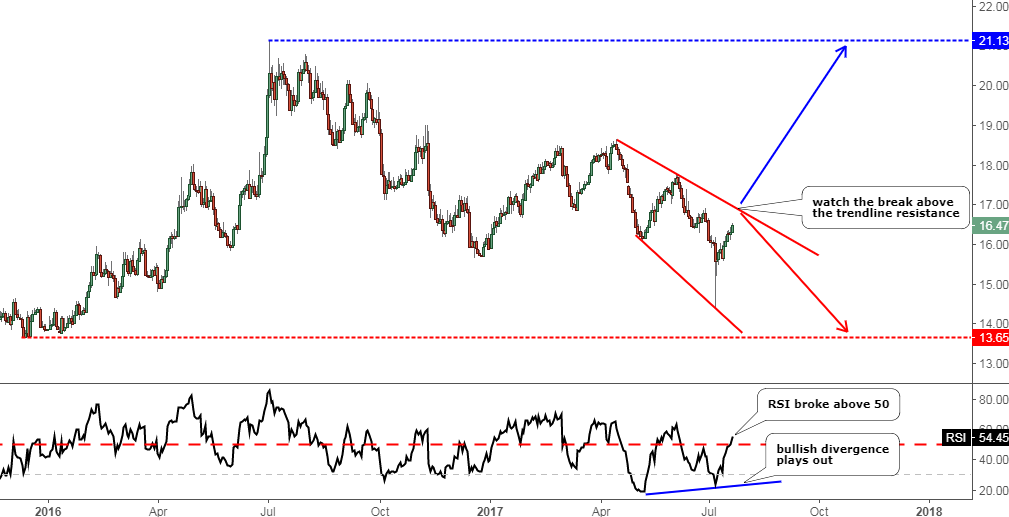
Chart courtesy of tradingview.com
The map for the silver move has changed after the price dipped deeply below the December 2016 low during the second leg of a complex correction, which is contoured with the red diverging trendlines.
The RSI has signaled two interesting alerts. The first is the bullish divergence as the indicator printed higher bottoms compared to lower troughs in the price chart. It is now playing out and moving sharply higher. The second alert is the consequence of the first alert. The RSI broke above the all-important 50 level, and this could support the silver price.
Back to the price chart, silver is not yet breaking the trendline resistance, although it quickly approaches it. The breaking point is located at the $16.90-$17.00 area, which is half a dollar away from the closing price. Watch the price action in that area closely as failure could spur the further drop of the metal.
The reversal of the silver price just started, and we have a lack of visible segments to be contoured within AB/CD segmentation technique. But the conservative target is still there at the previous major top at the $21.13 mark. Once we see the interim consolidation, we could apply more accurate target levels to the chart.
Intelligent trades!
Aibek Burabayev
INO.com Contributor, Metals
share
share
share
share
share
More from Silver Phoenix 500