Gold And Silver Update Still the Investment Opportunity Of A Lifetime!


Wow! What a week!! This week's decline in silver was on a scale not seen since the Hunt Brothers' silver liquidation of 1980. Silver was down 25.43% in only four days! How often does this happen? I had to find out, so I took the four-day percentage moves in silver going back to 1969, filtered out all moves of less than 25%, and plotted the results below. The answer is not very often!
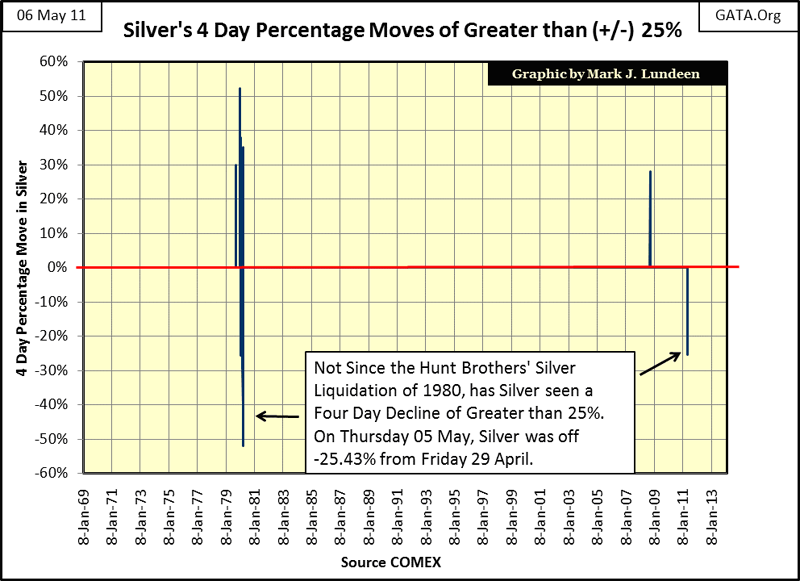
Like the 1980 liquidation, silver's 2011's precipitous decline was a manufactured event by the silver market's regulators. In 1980, with silver near $50 an ounce, regulators changed the rules for traders classified as speculators (any silver trader who wasn't a big bank). The new regulations prohibited going long (buying), allowing only sales of silver contracts. With the big banks (who have been short silver since Noah left the ark) the only entities in the COMEX silver pits allowed to buy, as you can imagine, $50 silver in 1980 was only a momentary blip on the radar screen.
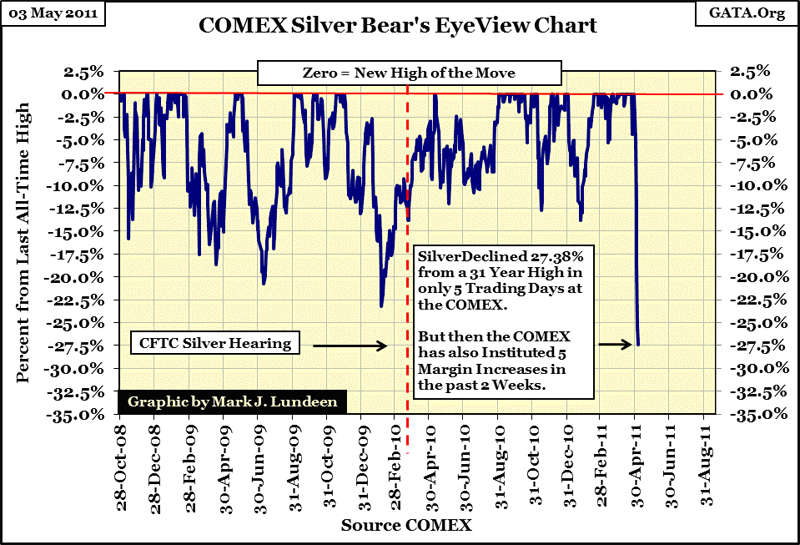
Funny, but just last Friday (29 April), with the closing price of silver only 0.24% from exceeding its all-time closing high of 1980, the regulators once again stepped in and changed the rules. This time they increased margin requirements FIVE TIMES in just over one week, forcing small, over leveraged speculators out of the market. The rest is history.
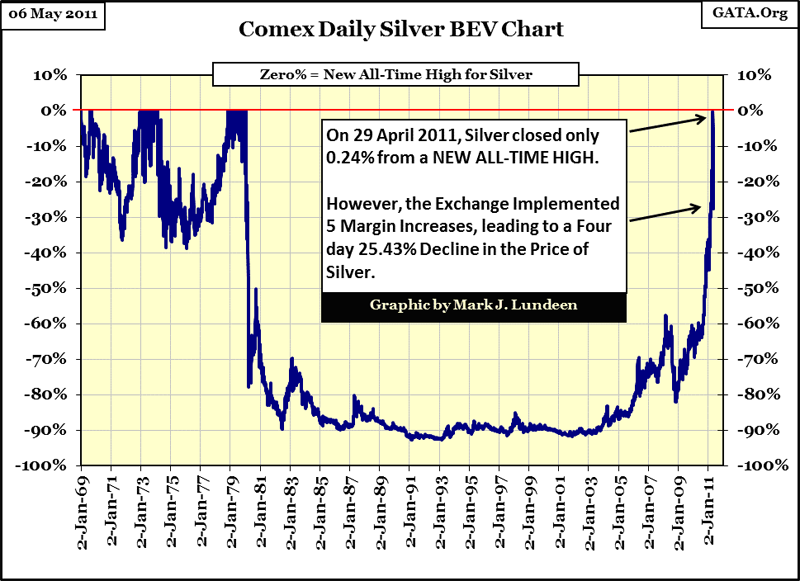
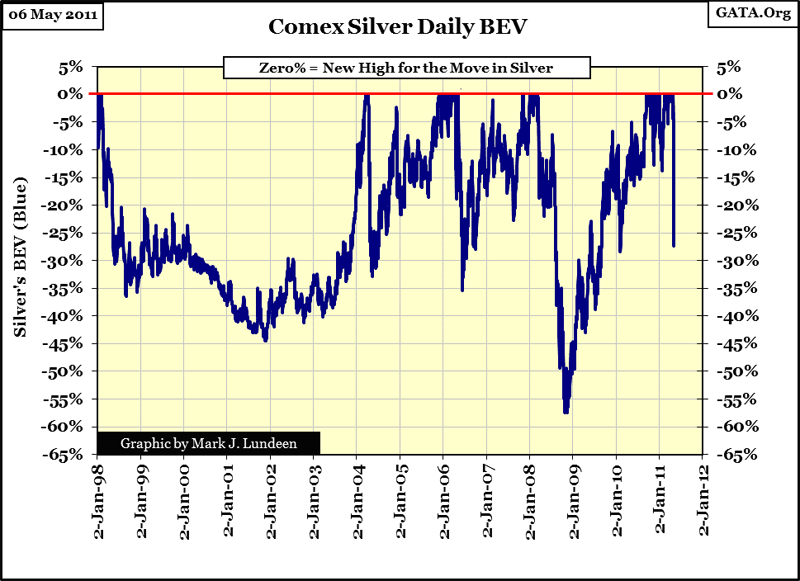
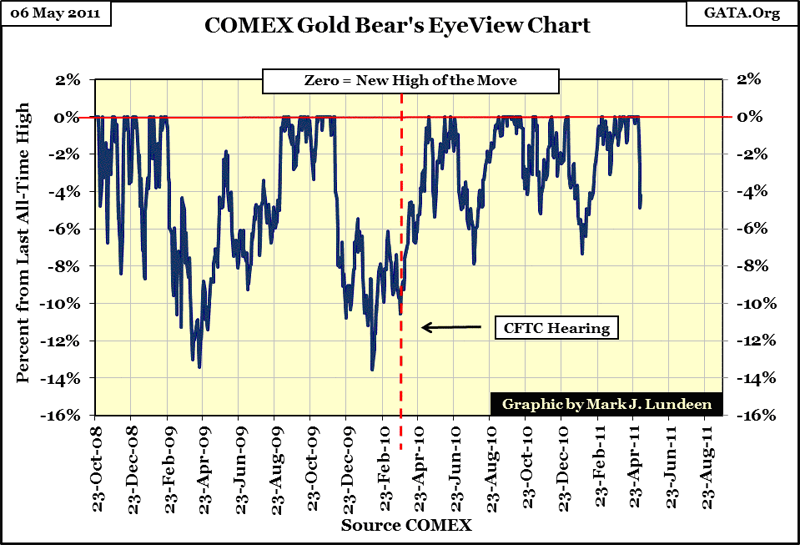
There can be no doubt that someone with influence over the Federal regulators objects to silver trading at $50. It makes the dollar look bad. The last time they whacked $50 silver, silver investors endured a 23 year bear market, with the price of silver glued for 10 long years to its BEV -90% line in the chart above. In other words, silver saw $50 for about 15 minutes in January 1980, and then its price was confined in a trading range between $3 and $4 for a decade. No doubt J.P. Morgan, and yes, even the Federal Government, would like to see a repeat of that performance - but will they? They don't have a snowball's chance in hell to drive the price of silver down to single digits this time. They'd be lucky to ever see silver trade below $30 again.
Why? Because deep beneath the markets, where buying and selling determines the prices of everything we see around us, there is a vast monetary aquifer on which all market valuations float. The Fed "injects" fresh "liquidity" every day of the week to support this or that financial market. But once these newly created dollars are spent in support of "policy", these dollars then sink down to the monetary aquifer. What in the hell is that? The monetary aquifer is the money in peoples' retirement accounts, bank deposits, and pension funds. In other words, it's the money the Fed has created in the past decades, but is now controlled by people not sitting on the FOMC.
So, every business day, Doctor Bernanke and all the dudes at the FOMC create new dollars which they "inject" into financial assets to "support the markets." Since 1982, the investing public and money managers have ridden on "policy's" coattails, and invested their savings, union dues, and insurance premiums exactly as "policy" intended. So you might say that "policy's" and the aquifer's interests have been the same for the past 30 years: investing in the inflating valuations of the financial markets.
But with rising consumer prices, all that is changing now. Financial assets are valued in the ever shrinking dollar, and that isn't good for stocks and bonds. The rising prices of commodities, gold and silver are signaling that the smart money knows the party is over in interest bearing assets. But the Fed isn't interested in profits, only in keeping the current valuation hoax, and the appearance of stability in financial assets going for as long as possible. However, in the monetary aquifer, where individuals and financial fiduciaries are only interested in making a profit, and can't accept the losses a massive bear market in stocks, bonds, and mortgage assets, would bring, investors and fund managers are completely capable of picking up the phone one day, and saying: "sell what is going down, and buy what is going up!"
To the horror of the "policy makers," there are tens-of-trillions of dollars in financial assets controlled by people who don't give a damn what selling their stocks, bonds and mortgage assets would do to the American banking system's reserves! Bond yields of 8% would substantially reduce the value of the banking systems' US Treasury's reserves, and ignite another American banking crisis. But to people who CAN'T PRINT MONEY, like the Fed does, selling their financial assets at some point in the future, and entering the inflating commodities market will be a matter of survival. They will be forced to speculate in commodities, and Gold and silver will look especially attractive as consumer prices continue to rise.
This sounds pretty bad for financial assets bulls, but can this be true? Well, if you understand the relationship between the valuation of financial assets and interest rates, you would see that this development is actually unavoidable. Looking at the next chart of the US Treasury's long bond yield for the past 58 years, this is exactly what happened from 1953 to 1982: consumer prices, commodities, gold (actually gold stocks, as gold was fixed at $35 until 1968) and silver went up, as financial assets went down, in both nominal and inflation adjusted terms.
In 1980, US Treasury long-bond yields were yielding double digits, but no one wanted Washington's "certificates of confiscation", even when they were yielding over 15%! You can read about it in Barron's from three decades ago. It took a 28 year bear market in bonds to drive bonds to this extreme. We should ask: what drove bond yields up so high? It was inflation from the Fed flowing into consumer prices from the early 1950s up until 1982! The ill-fated Carter Administration saw two consecutive years out of four with double-digit CPI increases. Day to day, these long term trends are not always apparent. But over the years, chronic increases in consumer prices have never been good for bonds, but always good for investments in gold and silver!
In the chart below, we see the 1982 reversal in US Treasuries yields as the financial markets responded to consumer prices stabilizing. The investment implications were profound: the inflationary flows from the Federal Reserve stopped flowing into commodities and precious metals, and began flooding into financial assets, like US Treasury bonds and stocks. Declining Bond yields from 1982-2008 resulted in a 26 year bull market in T-bonds, peaking during the Credit Crisis of 2008 when the US Long bond yield declined to just 3.04%!
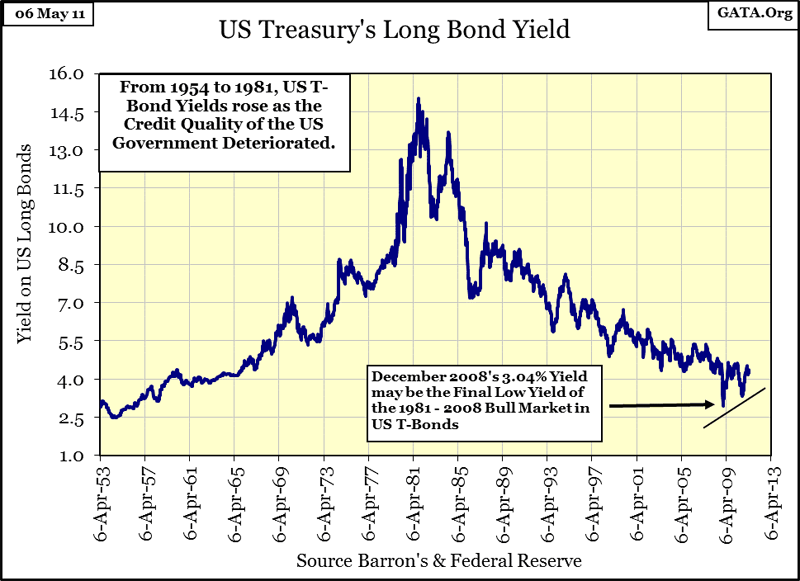
But the decline in yields and interest rates is now history. With consumer prices moving upwards again, we should anticipate a massive bear market in financial assets, rising yields and interest rates always bring. If the past is any guide to our future (and it usually is), precious metals will again outperform inflation. As you can see in the chart above, interest rate cycles can take many years to run from one extreme to the other. Because trends in gold and silver are countercyclical to trends in financial assets, and as the yields in the US Treasury bonds has just began their reversal in December 2008, and still a * long way * from their 1982 double digit highs, investors should anticipate accelerating increases in the prices of gold and silver for as long as the yields for US Treasury bonds continue to increase. This new trend in the markets will take years to complete.
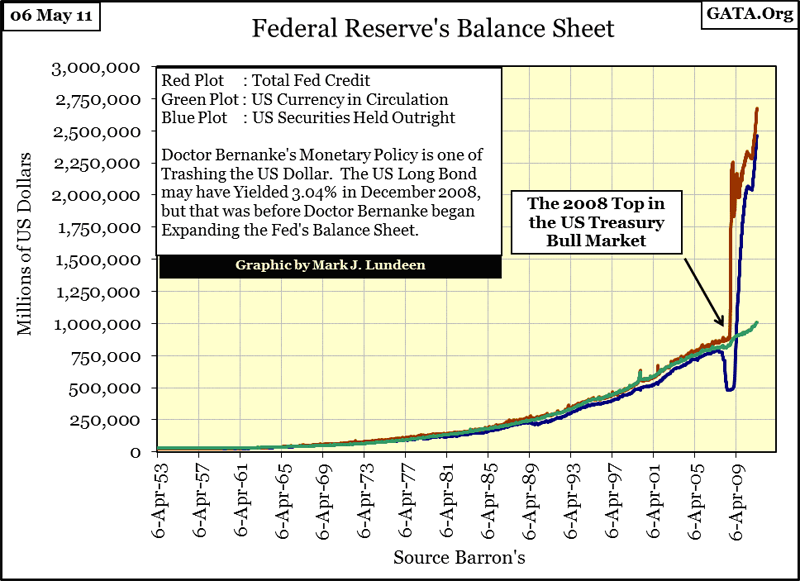
Aggravating this situation is having a Princeton-man, like Doctor Bernanke, as the helmsmen of US "monetary policy." Look at what he's done to the Fed's balance sheet! The doctor has been buying worthless mortgage assets from Wall Street's "unnamed favored financial institutions" (Red Plot) and US Treasury Bonds (Blue Plot), all in the name of "economic stability." There is going to be hell to pay for all this.
One of these days, the world is going to wake up and see that dollar just ain't what it used to be! Any economist with half-a-brain can see what's coming - a train wreck. But CNBC would never do anything so irresponsible as to give much air-time to opinions such as these. The last bond market bear (1953-82) took 26 years before T-Bond yields reached double digits (1953-79). So realize that these things don't just happen overnight. But Doctor Bernanke, andother academics from Ivy League Universities are hard at work as I write, "fixing" the economy, "stabilizing" the financial markets, and "correcting the excesses" in the silver pits at the COMEX. With a motley-crew like that managing "policy", don't be surprised when panic selling of all dollar-denominated bonds begins sometime in the next year or two. The situation being what it is in 2011, I'm sure it won't take 26 years for T-bond yields to rise from 4% currently to over 15%.
Here is a scary chart, plotting the 10-week moving average for the price of gold versus the US long-bond yield. From 1973 to 2001, trends for the US long bond yield and the price of gold paralleled each other. But all that changed ten years ago. What happened? Well, ten years ago the Greenspan monetary bubble machine broke down with the "High Tech Wreck", and Washington and Wall Street began "stabilizing" our financial markets with massive "credit injections" into the US real estate market. All things considered, ask yourself who in 2001 could see what was coming our way in 2011, investors in gold or the bond market?
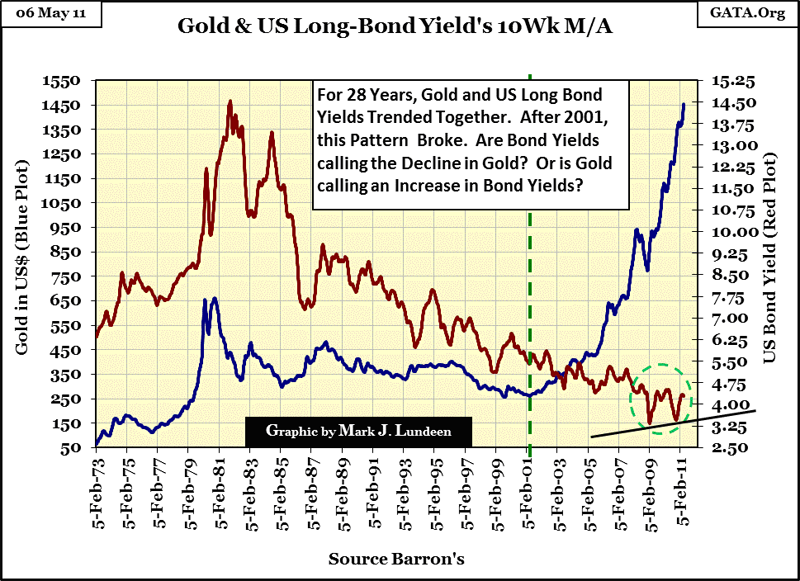
Seeing gold's 10-week moving average surging upward, while the US long bond yield 10-week moving average failed to break its low of February 2009, after not one, but two bouts of Fed Quantitative Easing, seems to suggest something. Take another look at my chart for the Fed's balance sheet (2 charts up), the blue plot is the sum total of the Fed's purchases of US Treasury Bonds. Since the 2008 credit crisis, the Fed has purchased TWO TRILLION DOLLARS IN US TREASURY DEBT, a 400% increase in the Fed's portfolio from its credit crisis lows!
My interpretation of the data above is that after a ten year break (2001-11) in a 28 year pattern (1973-2001), gold will continue rising in dollar terms, but now taking yields up, and financial valuations down in a traumatic bear market that will be remembered for generations.
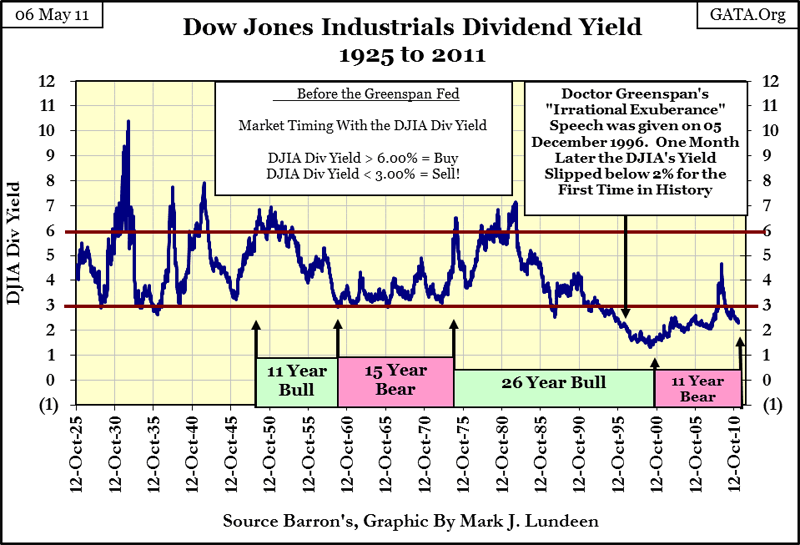
When interest rates and yields begin to rise in earnest, the stock market will no longer be a safe place to stash your hard earned savings! True, there can be periods where bond and dividend yields go their own way, such as from 1950-60, and from 2000 to 2009. But when credit quality, rising consumer prices, and inflationary US monetary policy become the primary concern of financial markets, as they were from (1960-82), all interest bearing assets become less than desirable investments.
Okay, so we had a bad week in silver. So what has changed in the long term perspective of the US dollar, or the American financial markets? Nothing!
I was a bit surprised at how well gold did this week. A Bear's Eye View (BEV) comparison of the price of gold and silver is very interesting. The price of silver was whacked with the steepest decline in the last 2.5 years!
But it wasn't as bad as the 58% correction silver saw in 2008!
Silver is famous for its bull market's deep corrections. When push comes to shove, there isn't a better counter-puncher than silver. The Champ may have stumbled this week, but he is only down, not out!
Gold on the other hand barely corrected.
It's very suspicious that gold didn't see at least a 14% decline in sympathy with the mugging silver took this week. But then again, gold didn't see five COMEX margin increases in less than two weeks like silver did. Why people choose to play silver and gold at the crooked tables of the COMEX is something I don't understand. Everyone who purchased physical silver at $48 an ounce last week, and took it home with them did far better, and will be glad they did in the months and years to come.
All in all, after reading the above, studying the charts, and comprehending the logic of my market views, you'll understand why I expect the bull market in gold and silver to go on for many more years. The gains in gold and silver in the coming years will be something to behold. In 2011, the crucial wealth preservation strategy for investors is to swap out of Doctor Bernanke's dollars, and into your own gold and silver. With nominal long term Treasury yields hovering at lows not seen the Eisenhower Administration, buying gold, and especially silver just might prove to be the wisest investment of our generation. And with real interest rates having gone negative for years now, with no sign of ever going positive, this is the exact environment when precious metals have historically outperformed other investments.
More from Silver Phoenix 500


