Gold And Silver Volatility 1969 To 2014…Looking Good For Silver


Lots of people on our side are thinking the big breakout is near. It could be but I’m not holding my breath as I wait for it to happen, although I know the day will come when the advances in gold and silver will be breathtaking. But when the precious metals bull does return, how can we be sure it’s the real deal? Increases in daily volatility!
Here are some charts for gold and silver daily volatility going back to 1969. With gold we are looking at every daily move of (+/-) 3% or more. The chart suggests that such moves are common, but as we see in the table at the bottom of the chart, since 02 January 1969 there have only been 415 days on the COMEX were the price of gold has moved more than 3% from its previous day’s close. That isn’t many when we consider that the COMEX has had 11,334 trading sessions during this time.
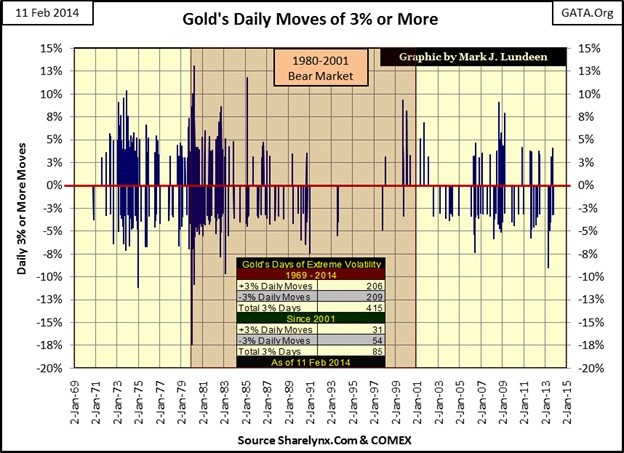
We can see how daily volatility for the 1969-1980 bull market and for the first three years of the 1980-2001 bear market was much greater than it has been so far for the 2001-2014 gold bull market. This is yet another of the many finger prints left behind by the manipulators of the gold market. When the “policy makers” lose control over the price of gold, we should expect some historic moves in the price of gold. Currently, the largest positive daily move occurred on 19 March 1980 with a 13.05% move, but this gain occurred two months after the top in the gold market. When this record daily percentage gain is finally exceeded, I expect it will prove to be a bull market event.
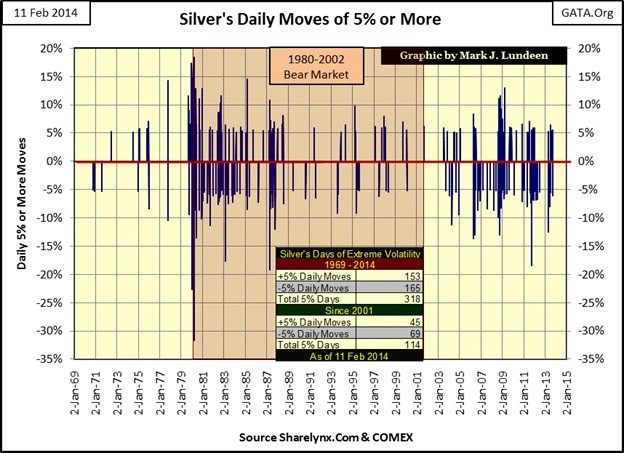
Here’s silver’s daily volatility, which I used a 5% threshold as silver is the more volatile of the two metals, though it sure wasn’t from 1969 to 1980. Like gold, I expect silver too will see record daily volatility when its bull market resumes. Currently the record daily advance was 18.33% seen on 31 March 1980, which followed an 11% advance from the previous trading day. Like gold’s record daily advance, these gains were bear market events seen shortly after the bull market highs of January 1980.
Here is the Silver to Gold Ratio going back to January 1969 and what we are seeing below is how many ounces of silver one ounce of gold will purchase. In February 1991 an ounce of gold could purchase 101 ounces (6.3 pounds) of silver – wow!
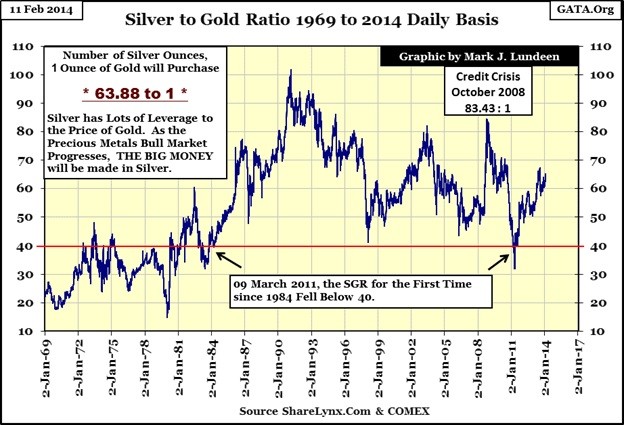
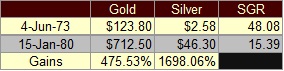
It’s a truism that during gold bull markets an investment in silver proves to be more profitable than gold, at the top of the 1969-1980 bull market an ounce of gold could purchase only 15.5 ounces of silver, a big decline from the 48 ounces it could purchase in June 1973 when gold and silver prices were far from their 1980’s highs. The little table below displays the superior performance silver had over gold from 1973 to 1980 as the SGR dropped from 48 to 15. With the current SGR at 64, silver today is a much more attractive investment than it was in 1973.
As our bull market in gold and silver resumes, we can expect as during the 1969 to 1980 bull market, an ounce of gold will be able to purchase less and less silver as the precious metals bull market continues, making investments in silver more profitable than those in gold. What the ultimate SGR will be can now only be guessed at, but the current rigging in the financial and precious metals markets has devastated the market’s pricing mechanism so I’m ready for surprises. As above ground silver supply today is actually rarer than gold, industrial demand for silver could drive the price of silver above the price of gold. Mind you that is no guarantee from my part, but seeing the SGR decline significantly below the 15.39 ounces of silver for an ounce of gold seen in January 1980 is very likely in the years to come.
More from Silver Phoenix 500


