Gold & Silver Profit Booking Strategies


“Another sign that investors are moving back into gold came from Barclays on Monday, as they said exchange-traded products recorded their biggest daily inflow since January 1 on Friday at 5.8 metric tons.” – Wall Street Journal, August 27, 2013.
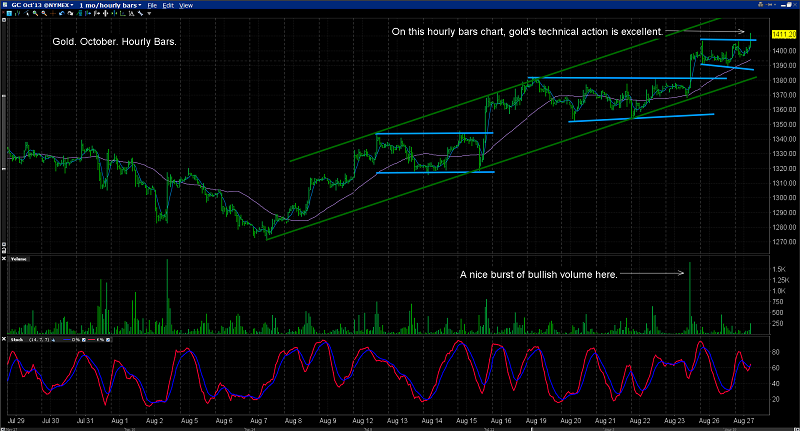
You are looking at the hourly bars chart for gold. All the “technical lights” are green. The early morning spike to $1411, if it holds, should attract even more ETF buyers.
That’s good news, but it’s very important that farmers harvest their crops, rather than leaving them all in the field. Farmers who bet their whole crop on much higher crop prices can get wiped out.
Likewise, precious metals investors need to book some profits into this superb rally.
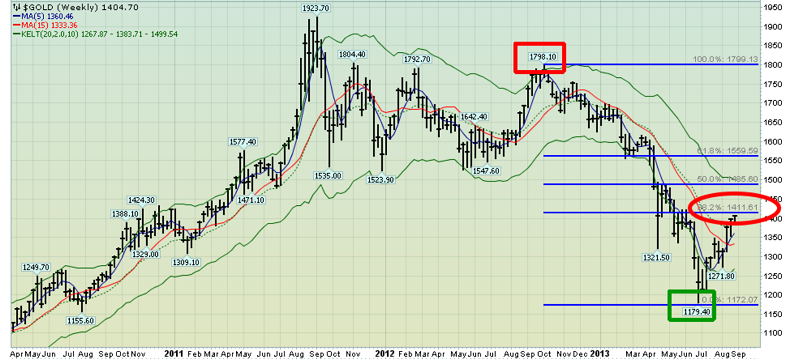
That’s the weekly gold chart. I’d like you to make note of the $1411 price area. It’s a key Fibonacci retracement zone, and it could attract some technical selling.
I view the entire $1400 - $1550 price zone as a giant “field of profits”. These profits can only be harvested by investors who bought the “shock and awe” decline that took gold down towards $1180.
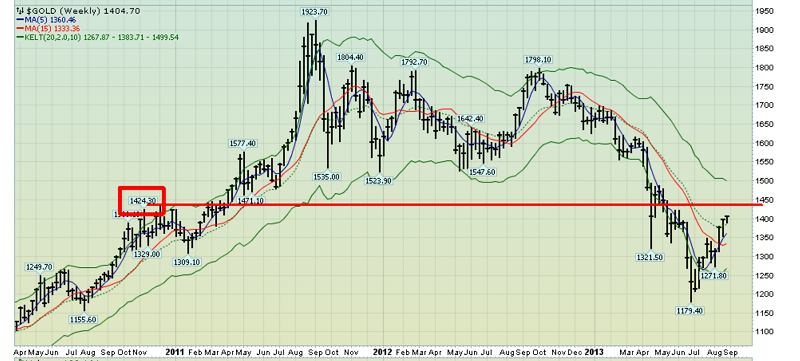
That’s another look at the weekly chart. In the fall of 2010, gold stalled in the $1425-$1450 area. A number of technical analysts at major banks have suggested that gold could have trouble in that same area again.
$1471 is another area where sell-side HSR is visible, and the biggest overhead HSR (horizontal support and resistance) on the weekly chart sits in the $1523 - $1577 price zone.
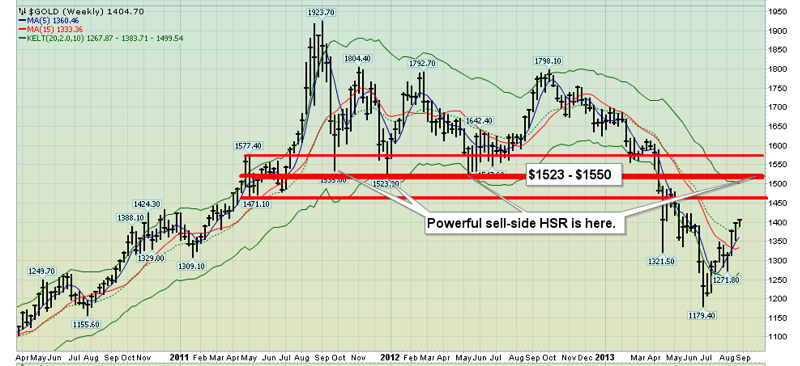
When gold fell below $1500 in April, a lot of investors couldn’t take the pain, and sold positions. They may use this rally to try to sell even more, fearing a drop to new lows. Their actions, albeit wrong in my opinion, could put additional pressure on gold in key overhead HSR areas.
Cheer for a higher gold price, and sell if you get it.
How much gold should you sell? Well, core positions should never be sold, regardless of your price targets or fundamental scenarios.
Gold is arguably the ultimate asset, so it probably can be viewed as wealth, rather than a tool to get wealth. Key core positions that are accumulated on severe price weakness should be held with an iron hand.
In contrast, trading positions could be “offloaded” at $1411, $1440, $1471, $1523, and $1577.
That’s the strategy I’m following myself, and I’ve sold at $1411 this morning. I use my “pyramid generator” on my website to systematically scale out of positions, at key profit-booking price zones.
What about…. silver? Silver has been outperforming gold over the past few weeks by a wide margin.
So, silver investors have more profits than gold investors from this rally. In my professional opinion, the gold chart is more important than the silver chart. If gold surges, so does silver.
If gold falls, silver also falls. If gold reaches a price area where it could stop rising, silver is also likely to stop there. Tactically, I sell silver when I sell gold.
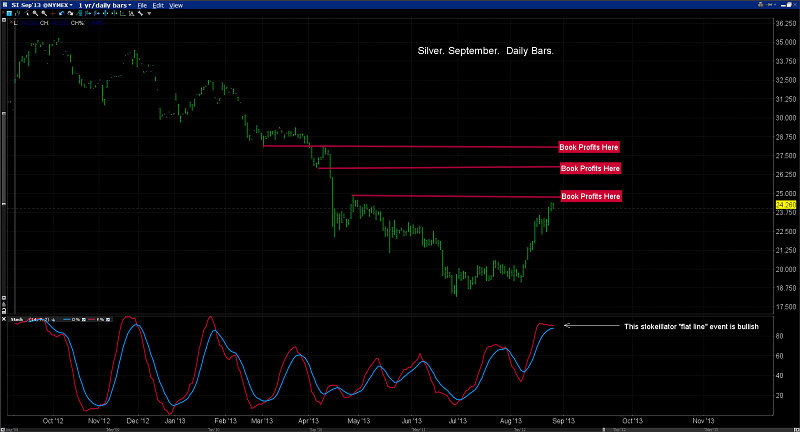
Regardless, silver chart purists, see chart above. For short term traders, $24.80, $26.50, and $28 are 3 nice profit-booking zones.
I have no idea if gold and silver have made an “ultimate bottom” or not, and I really don’t think any wealth is built by getting overly-obsessed with that question.
If gold has bottomed, that’s great news. If it hasn’t, investors can use profits booked now to buy lower prices, with some degree of comfort, rather than selling in terror.
Is there a GDX-gold bullion non-confirmation in play? Some investors are concerned that key gold stocks have not exceeded their recent highs, but gold has.
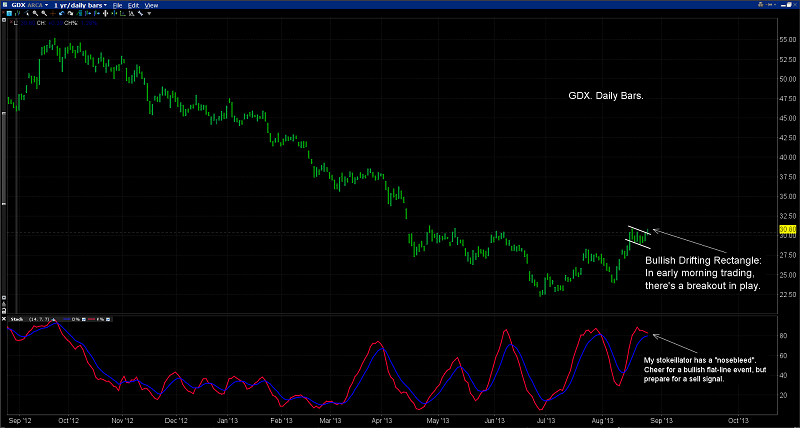
A lot of analysts believe that gold stocks lead gold. That’s often true, but not all the time! You are viewing the GDX daily chart. In early morning trading today, GDX has traded at $30.80, and broken out upside from a small but very bullish drifting rectangle pattern.
Note the position of my stokeillator (14,7,7 Stochastics series) at the bottom of the chart. It’s in “nosebleed” territory, but that’s also where it tends to be, when sizable upside breakouts occur. It can “flat line”, and move sideways while staying above 80 for quite some time, if the breakout creates a trending move to the upside.
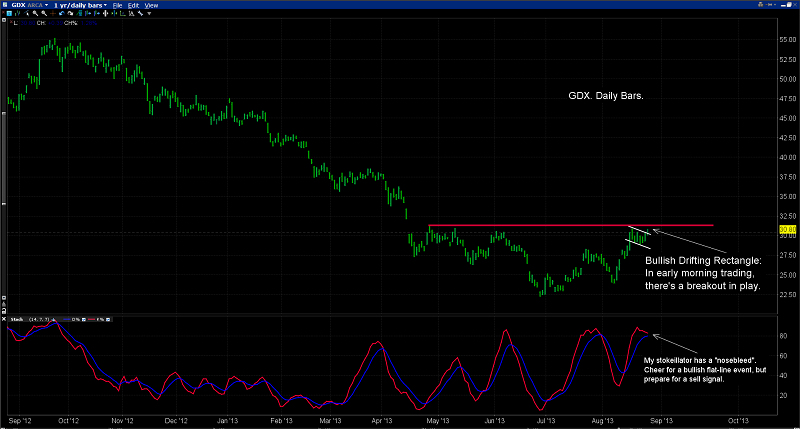
That’s the same GDX chart, but I’ve used a red HSR line to highlight key highs in the $32 area. The breakout from the drifting rectangle could provide the technical buying required to push GDX above $32, and create a wave of institutional buying. My next profit booking area of size for GDX is $37. If GDX can get there, many of your individual gold stocks could have tremendous gains!
********
Special Offer For Gold-Eagle and Silver-Phoenix500 readers: Send me an Email to freereports4@gracelandupdates.com and I’ll send you my free “Explorers With Volume!” report. Even if there is a correction in the general precious metals market, many individual stocks could power higher anyways! I’ll show you the ones I’m looking at right now.
Email: stewart@gracelandupdates.com
Mail to:
Stewart Thomson / 1276 Lakeview Drive / Oakville, Ontario L6H 2M8 Canada
Risks, Disclaimers, Legal
Stewart Thomson is no longer an investment advisor. The information provided by Stewart and Graceland Updates is for general information purposes only. Before taking any action on any investment, it is imperative that you consult with multiple properly licensed, experienced and qualifed investment advisors and get numerous opinions before taking any action. Your minimum risk on any investment in the world is: 100% loss of all your money. You may be taking or preparing to take leveraged positions in investments and not know it, exposing yourself to unlimited risks. This is highly concerning if you are an investor in any derivatives products. There is an approx $700 trillion OTC Derivatives Iceberg with a tiny portion written off officially. The bottom line:
Are You Prepared?
 Stewart Thomson is president of Graceland Investment Management (Cayman) Ltd. Stewart was a very good English literature student, which helped him develop a unique way of communicating his investment ideas. He developed the “PGEN”, which is a unique capital allocation program. It is designed to allow investors of any size to mimic the action of the banks. Stewart owns GU Trader, which is a unique gold futures/ETF trading service, which closes out all trades by 5pm each day. High net worth individuals around the world follow Stewart on a daily basis. Website: www.gracelandupdates.com.
More from Silver Phoenix 500


