The Great Non-Rotation


The Investment Company Institute (ICI) estimated weekly net cash outflow from bond mutual funds of $13.5 billion during the week of June 12. This followed a staggering $10.9 billion outflow the previous week. So began a steady exodus from bonds and bond funds in June that has continued until now.
Until recently, bonds were the safe haven du jour among investors who preferred to park cash in low-yielding debt instruments in the wake of the 2008-2009 credit crisis. Investors never got over their fear of equities, even as stocks outperformed in the years 2009 through 2013 to date. The dramatic leap in Treasury yields over the last three months changed this attitude, however.
Since June investors have continued running for the exits in the bond market. Last month’s bankruptcy of Detroit only added to this impetus and resulted in wholesale dumping of municipal bond funds. In the last two weeks investors have increasingly unloaded muni-bond funds, so much so that the disturbingly high number of new 52-week lows on the NYSE has been comprised almost entirely of these funds. Witness Tuesday’s 191 new lows; it marks the first times since June 25 that there were more new lows than new highs. It’s also the first time since June 25 that there were anywhere near this many new lows.
So with investors running to the exits for bonds, does this mean we’ll finally see the long-awaited rush into equities the experts have been predicting? Well it hasn’t happened yet as the following chart (data courtesy ICI).
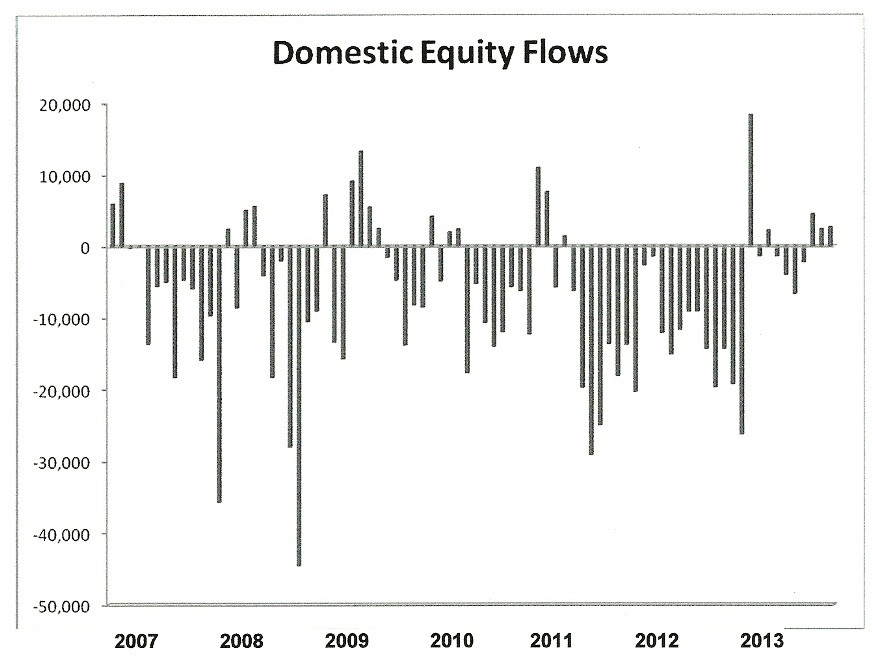
While there was a sharp inflow into equity funds at the beginning of this year, since then the flows have greatly diminished and in some cases have even gone negative. For example, during a 2-week period in 5-12 when bond fund outflows totaled $24.4 billion, equity fund inflows actually had net outflows of $2.0 billion. Domestic equity flows for the week ended July 31 were also negative by almost $1.0 billion. Meanwhile the exodus from bonds and bond funds continues apace with no corresponding return to stocks or equity mutual funds. Clearly the “Great Rotation” Wall Street is hoping for hasn’t happened yet.
Before we try to answer why, let’s look back at how we got here. First it was the euro, then gold and silver, then the emerging markets, then bonds. One “safe haven” after another has been shot down. The proverbial “last Indian standing” is the U.S. stock market, yet the average retail investor isn’t exactly making tracks to jump on this bandwagon. If not stocks, where are investors’ funds going? For now the movement is into cash as investors remain unconvinced that long-term stability has returned to the financial market.
So why haven’t investors warmed to equities after a record-breaking recoil rally off the 2009 crash lows? They’ve sat on the sidelines for the last four years as stocks have powered ahead each year, completely erasing the losses from the credit crisis and then some. Could it be that the memory of the painful credit crisis still lingers and is overpowering the innate desire for gain? After all, safety has trumped capital gains as a dominant investment theme these last four years.
As we discussed in last week’s commentary, cash is king in a deflationary environment. Following the credit crisis the demand for money exploded as investors liquidated stocks and commodities in a frantic bid to raise cash. The strong demand for T-bills began in late 2007, and from then through mid-2008, the Fed sold almost its entire holdings of T-bills – about one-third of the monetary base – in order to satisfy the world’s insatiable demand for safe assets.
For the last three months, however, investors have been hastily selling those T-bills and other interest rate-sensitive investments. Yet there hasn’t been a corresponding rush back into equities as of early August. One reason for investors’ tepidness toward stocks is undoubtedly because the record amount of liquidity created by central banks is being to some extent cancelled out by the strong undercurrent of long-wave deflation. With the 60-year cycle in its final “hard down” phase between now and late next year, deflationary forces will become manifest at times despite the Fed’s best efforts. We’ve already seen glimpses of this in the periodic crises of the last three years in various parts of the globe. As the 2014 cycle bottom approaches, these periodic eruptions will likely intensify.
A strong and sustained rotation back into equities isn’t likely to occur before next year’s cycle bottom. After 2014 when a new long-term inflation cycle has begun is when investors will have the incentive to “rotate” back into something other than cash. As long as uncertainty prevails, however, the long-awaited Great Rotation will be postponed.
Gold Mining Stocks
The last few days have been good ones for gold but even more so for the gold and silver mining stocks. The mining sector was helped by a weak U.S. dollar, which fell for five straight days last week.
Let’s have a look at the gold/silver mining stock group via the XAU index. With the XAU index I’m not going to evaluate the interim trend by looking at any trend lines or moving averages, which can sometimes cloud the issue. While I do believe certain moving averages are important, especially for the immediate-term trend, I also believe there’s a danger of attaching too much significance to moving averages. Traders sometimes fall victim to the trap of attributing almost mystical powers to certain moving averages, and this can be a dangerous error. When evaluating the main interim trend of the XAU it’s often best to just look at the “naked” chart without any technical adornments such as moving averages.
With that proviso, let’s examine the year-to-date chart of the XAU index. As you can see, each and every rally attempt so far this year has met with failure; the turnaround attempts as far back as January were reversed into lower lows, which amounted to a continuous downtrend.
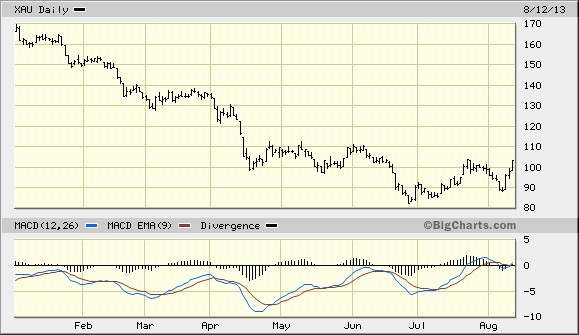
By definition a reversal of the trend requires the market to break this chain of lower highs and lower lows by establishing a final low. In other words, the market has to succeed in making an initial higher low and higher high, which in turn becomes the first step in a new upward trend. As we’ve seen already, days like today where the XAU has rallied have normally failed to reverse the downtrend. But one thing that has already distinguished the XAU’s chart pattern over the last few weeks is that the index is in the process of establishing a higher low.
If the XAU succeeds in following through in the coming days by pushing above the nearest high of 103 on a closing basis (the July 23 closing high) then we’ll have our first confirmed instance this year of a higher low and a higher high. In other words, we’ll have the beginnings of a genuine turnaround as opposed to another “dead-cat bounce.”
High Probability Relative Strength Trading
Traders often ask what is the single best strategy to use for selecting stocks in bull and bear markets? Hands down, the best all-around strategy is a relative strength approach. With relative strength you can be assured that you’re buying (or selling, depending on the market climate) the stocks that insiders are trading in. The powerful tool of relative strength allows you to see which stocks and ETFs the “smart money” pros are buying and selling before they make their next major move.
********
Find out how to incorporate a relative strength strategy in your trading system in my latest book, High Probability Relative Strength Analysis. In it you’ll discover the best way to identify relative strength and profit from it while avoiding the volatility that comes with other systems of stock picking. Relative strength is probably the single most important, yet widely overlooked, strategies on Wall Street. This book explains to you in easy-to-understand terms all you need to know about it. The book is now available for sale at: http://www.clifdroke.com/books/hprstrading.html
Order today to receive your autographed copy along with a free booklet on the best strategies for momentum trading. Also receive a FREE 1-month trial subscription to the Momentum Strategies Report newsletter.
More from Silver Phoenix 500


