Grinding, Grinding, Stocks Keeps Rising – Wait, ADP Is Here!


Tuesday was again one of those days of higher stock prices. Seems boring, I know, but there are still intraday opportunities to take advantage of. For instance, I took long profits off the table before much of the downswing hit, and reentered on the long side during the regular session's opening selloff yesterday.
Enjoying the rally continuation, and still thinking that calling tops or corrections is a fool's errand, I prefer riding the bull responsibly as that's definitely more friendly to one's trading equity. One can't be too cautious these days with such extreme greed readings, though…
For example, this is how I commented on the setup in today’s Alert:
(…) The S&P500 outlook remains bullish, but I see prices dipping below their current 3550 level as more likely than not during today's session - especially if the market doesn't like today's ADP non-farm employment change. And chances are, its bar (1,250K expected), will prove a bridge too far.
The market indeed dipped right after the open, and I cashed profits again – just like yesterday.
Let's dive into the key charts and feel the market pulse – again and continuously.
S&P 500 in the Short-Run
I’ll start with the daily chart perspective (charts courtesy of http://stockcharts.com ):
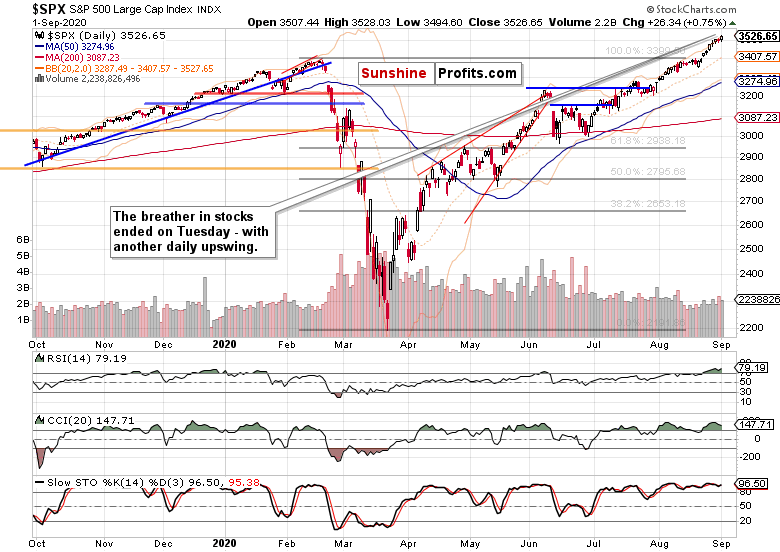
After Monday's move turning out not really either way, stocks rose powerfully yesterday. Best of all, the volume wasn't at levels associated with distribution.
The Credit Markets’ Point of View
High yield corporate bonds (HYG ETF) finally joined in the buying spree yesterday, and the rising volume bodes well for the upswing to continue (please see this and many more charts at my home site). That's positive for stocks – and even more so given the strong day in investment grade corporate bonds (LQD ETF) too.
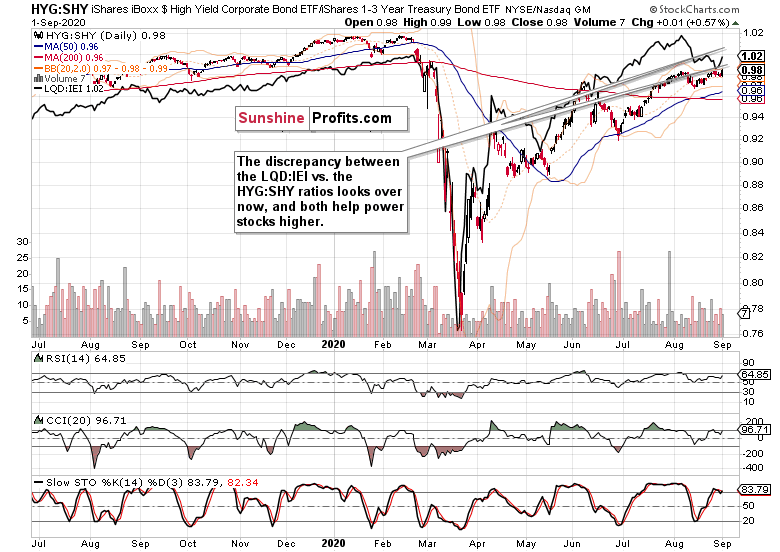
Both leading credit market ratios - the investment grade corporate bonds to longer-dated Treasuries (LQD:IEI) and high yield corporate bonds to short-term Treasuries (HYG:SHY), are once again in unison, and supporting higher stock prices.
The stocks to all Treasuries ($SPX:$UST) ratio keeps pointing to the stock market rising in favor, relatively speaking. And given the macroeconomic backdrop (the inflation move from the Fed), I view stocks as a still an undervalued asset class.
Yes, regardless of the tech valuations which will get even more outrageous in my opinion. Because TINA – there is no alternative in the hunt for yield than to move ever farther on the risk curve. This hated bull run will see more money deployed before making a top that I don't see happening this year, not at all.
From the Readers' Mailbag
The first question is actually a follow-up to the most recent one – you'll find it my yesterday’s Alert:
Q: Thank you so much Monica for the comment on the Cot Report. I understood perfectly your explanation, and it really makes sense. Yes, I had a lot of doubts about the way of that italian trader to trade the sp500, he write every week from more the 12 years in a website of economic information, and he comments how to read and use the Cot... in any case, he has been always long from the 2009, and even with the correction that the market had, he is very proud of trading sp500 using the Cot. And holding position long from when it was around 1000. For sure is good for him, he made a lot of money staying long from 2009, but is not my way to trade for sure ... still thank you, and my appreciation for your topic/ analysis
A: Thank you, I am glad you enjoyed the answer. My point is that exclusively using such a blunt tool that also pointed to the stock market bottom in March 2009, requires one to have a pretty strong stomach as there have been many instances since, where its signals were less than strong or totally reliable.
Still, the Italian trader captured the long-term move – but my style is very different for I seek to catch both the medium- and short-term moves. Not a permabull, not a permabear. I pay great attention to the risk-reward ratio, and continually manage my open trades so as to improve this key characteristic. My maxim is to take care of the downside, and let profits grow – subscribers are updated in real-time for I issue many intraday Alerts (whenever market situation requires that).
Combining technicals with fundamentals heavily, I view information, data and headlines as being one or the another way discounted in the price chart(s), and the most profitable way of approaching these is to be trading market reactions to changing data and narratives – attentive to the main trend. As a macroeconomist, I could venture into the data much deeper - the same goes for my extensive political or medical knowledge. But I do so only as regards stock prices, or other markets I comment on. False or not, happening or delayed, my job is to identify such moves and profit on them - and to help as many people (subscribers or free readers) do the same too.
There are many factors involved in my calls with shifting weights assigned - I am not taking a mechanistic, quantifiable view. What I think as a result, having considered them all, is presented – and you read those missives in my daily key analysis on the net...
Q: MK without divulging any personal information can you describe a reasonable approach to utilizing trailing stop loss percentage range....I am looking more for a reasonable theoretical approach to the current market situation and using trailing stop loss percentages. 2% 6%? or some other range and any theory or thoughts you would share knowing it is a personal choice. I read 2% for bond ETFs and 6% for equity ETFs.
A: Thank you for your question. First of all, this is a very special market – a strong bull, still very much hated, powered by a few key sectors at nosebleed valuations while the others lag, amid a slow but ongoing recovery from a mini-depression that can still turn into something more serious if the monetary and fiscal support gets unplugged whichever way.
Every trade starts with a moment of entry, where you look at how much you're willing to risk for what kind of gain (where the market realistically has the power to reach). Such sketch of the open trade enables you to set how much of your trading account you're willing to risk in a given trade – my very rough preference is between 2-6% indeed, but I have seen systems work with even 15% in case of taking medium- and long-term trades predominantly. Charting the trade idea helps with planning ahead where could those tactical milestones of where you could move the trailing stop-loss so as to lock in open profits, be.
See? I am not talking percentages much. It's a question of win rate, and risk-reward ratio – coupled with discipline to take both profits and losses. In every trade, I look at momentum, volume, intermarket analysis, headline risk, personal anticipation of the coming short- or medium-term move, and first of all – the price chart of the traded asset.
Used correctly, this technique has the power to improve one's equity curve greatly. Just like other money management techniques that I am not diving into these articles, because they fit very different trading approaches, risk tolerance, and influence the stability of returns. And that's exactly what professionals aim for – to have a low, predictable volatility on the downside. That's precisely the gist of what I wrote right above: "take care of the downside, and let profits grow".
The point is about judicious and logical tightening, where you evaluate the scenarios, and answer for yourself whether the market does or doesn't have the power to likely get there. That can be set tight, that can be set wider – it differs, because every moment in the markets is unique. Unique, but to a certain degree fitting a more or less distinct pattern.
Applied to the current situation, the direction is solidly higher in stocks, volatility is generally declining, but a correction can come with little notice. In September, I look for it to be rather shallow (still a positive month), but in October, I expect a steeper one (we'll see, I wouldn't be surprised at all if the month ended in the red). The medium-term trend is higher, and it is your friend – that's the long-term view.
Summary
Summing up, the S&P500 market character hasn't changed, and it's still bullish. The case for a pause hasn't disappeared, but with solid credit market and tech performance, keeps being moved into the future. As the put/call ratio keeps sliding and sliding, it's my opinion that the pause is approaching – and today's ADP non-farm employment change could very well be the catalyst of such. Relatively shallow correction within a bull run, that is – which I, as a medium- to short-term trader, prefer to pass by and wait for a stronger setup to deploy capital again.
Thank you for reading today’s free analysis. I encourage you to sign up for our daily newsletter - it's absolutely free and if you don't like it, you can unsubscribe with just 2 clicks. If you sign up today, you'll also get 7 days of free access to the premium daily Stock Trading Alerts as well as our other Alerts. Sign up for the free newsletter today!
Monica Kingsley
Stock Trading Strategist
Sunshine Profits: Analysis. Care. Profits.
* * * * *
All essays, research and information found above represent analyses and opinions of Monica Kingsley and Sunshine Profits' associates only. As such, it may prove wrong and be subject to change without notice. Opinions and analyses were based on data available to authors of respective essays at the time of writing. Although the information provided above is based on careful research and sources that are believed to be accurate, Monica Kingsley and her associates do not guarantee the accuracy or thoroughness of the data or information reported. The opinions published above are neither an offer nor a recommendation to purchase or sell any securities. Ms. Kingsley is not a Registered Securities Advisor. By reading Monica Kingsley’s reports you fully agree that she will not be held responsible or liable for any decisions you make regarding any information provided in these reports. Investing, trading and speculation in any financial markets may involve high risk of loss. Monica Kingsley, Sunshine Profits' employees and affiliates as well as members of their families may have a short or long position in any securities, including those mentioned in any of the reports or essays, and may make additional purchases and/or sales of those securities without notice.
********

Monica Kingsley is a trader and financial markets analyst. Checking dozens of charts daily, she integrates their messages with economics and in-depth experience. Trade calls and writing are her cup of tea as much as studies in market histories. Having been at the financial markets when the Great Recession arrived, she experienced many bull and bear markets - be it in stocks, bonds, gold and silver. https://www.monicakingsley.co
More from Silver Phoenix 500


