Higher Silver Prices: The Fundamental Case
 share
share
 share
share
 share
share
 share
share
 share
share
 In our previous article, we discussed the technical case for a significant long-term bottom now being put into place in the silver market, of magnitude comparable to the bottom we saw in late 2008, which led to a 400% rally in silver, and over 1,000% gains in many of the top-tier silver miners.
While we tend to focus on technical indicators in our analysis, the significance of such a pending rally in the precious metals forced us to take a step back and ask ourselves the question again: what are the fundamental drivers of such a pending move? What is actually going on amongst miners, scrappers, hedgers, jewelers, industrialists, and investors that is setting up for such a major revaluation of this historically monetary metal?
While we value studying charts and patterns -- and indeed believe that all of the fundamental data that is known to the market (the sum of all participants in the sector) shows up in the charts (i.e. the current price) -- we remain fundamental-based investors at heart. That is to say: we understand that fundamental drivers are what move the market over the long run.
So we took a step back and sought to refresh our perspective by looking at the long-term trends developing on both the supply and demand sides of the silver market.
Our review follows: we are more bullish than ever on silver prices and believe that the moves we have seen over the last 10 years are but a mere preview of the price level that is to come over the next decade.
A Review of Silver's Fundamentals
A review of the fundamental case for silver reveals an extremely bullish scenario for those investors with at least a several year timespan and the tolerance for high volatility.
The scenario centers on an investment premium now being priced into a historically monetary metal that concurrently has the backdrop of significant industrial demand. This industrial demand is highly inelastic at or even above current prices.
Silver Mine Supply Growing Slowly
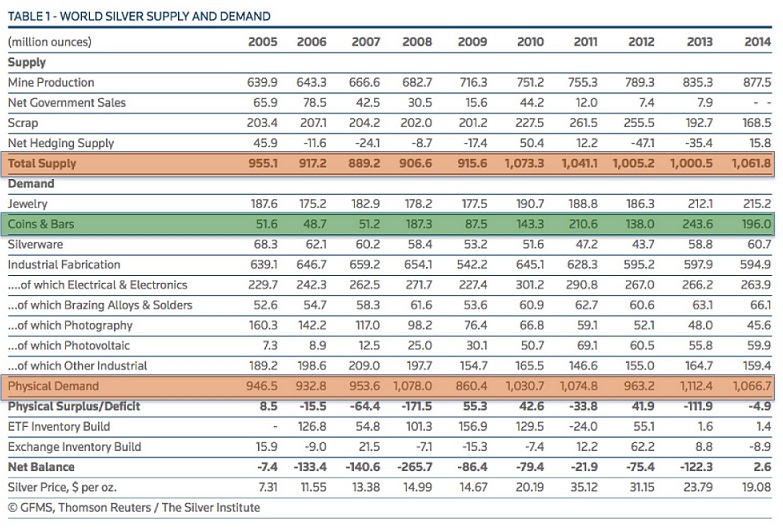
In reviewing the past ten years of data for silver (courtesy Thompson Reuters / The Silver Institute), we find overall supply that has increased 11% since 2005 to just over a billion ounces per year (first orange row on chart above). Of that, mine supply has seen consistent year over year production increases to 878M oz., while government sales have flat lined, and scrap production is down 18% over the same time period.
The data shows that mine production is the key supply source, accounting for nearly 80% of the market. This mine supply, while slowly increasing, cannot respond to quick changes in demand, as the exploration-development-extraction lifecycle for mining companies can take well over a decade to bring new silver to market.
Silver Fabrication Demand is Inelastic
Turning to the demand side, we see that net physical demand for silver has increased roughly 13% in the past 10 years, again to just over a billion ounces per year (second orange row on the chart above). While silverware use is flat and overall industrial fabrication is down slightly, zooming in on the details here gives us much more insight as to the emerging long-term trends.
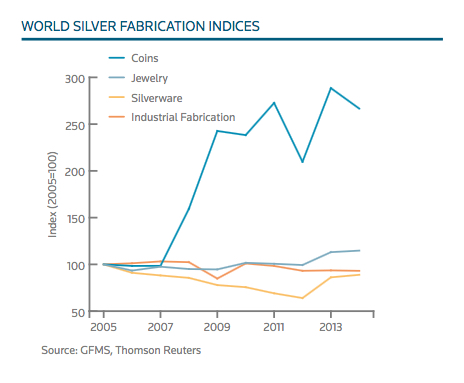
The bulk of the industrial drop comes from photographic use for silver, which has fallen by over 2/3, to a low of 45 million ounces in 2014. At the same time, electronic fabrication is up 15% to 266M oz., and photovoltaic use has jumped over 8-fold to almost 60M oz.
The key then is to note that the bulk of the industrial drop has already occurred -- in the photographic category. At current decline rates, it will only take a few more years for photographic use to be negligible. The rest of the industrial side taken as a sum shows increased demand over the last 10 years.
This increased industrial demand is largely inelastic, as can be seen by the fact that the uptrend has occurred during a time when silver prices have moved from an average of $6 per ounce to nearly $16 today. The reason for the inelasticity is that for most industrial applications, there is not a suitable replacement for silver. For example: in solar panels, computers, and cell phones, the total cost for silver in the manufactured components is such a small fraction of the overall materials cost, yet so essential for production, that it does not matter whether the price is $6, $16, or significantly higher. There exists no acceptable substitute.
Silver Investment Demand is the Key Price Driver
On the investment side (highlighted in green on the chart above), the most significant item to note is that demand for coins and bars has risen nearly four-fold over the last decade to 196M oz. This demand sits at the margin, and is by far the most variable; for example falling 35% from 2011 to 2012, before rising 75% from 2012 to 2013 to the highest demand on record, 243M oz. Yet despite the variability, the trend is clear over the last decade: silver is being demanded increasingly as an investment store of value.
Speculation as the Art of Profit
Speculation is the nature of all investment. To make a profit as investors, we must have a belief that is above and beyond what is currently accepted by the mainstream. We must view more perspective, or know more information, than the sum of the other market participants in order for there to be a discrepancy in prices. It is only in discrepancy between current prices and future prices there is the potential for gain.
So let us speculate for a moment.
Why is silver seeing this recent increase in investment demand? Why are there four times as many investors buying silver bars and coins now compared to a decade ago?
Our analysis is that silver is regaining some of its historic monetary role. Indeed, for most of the history of human civilization, while gold has traditionally served as a store of wealth, silver has been used for smaller monetary exchanges. To this day in Spanish, the word for silver is the same as the word for money ('plata'). It is only since 1965, when the last US quarters and dimes containing 90% silver were removed from circulation, that silver has not had a direct monetary role. We thus exist in what can be viewed as a 50-year 'experiment' in human history with silver not serving as money.
As a society, have we progressed for the first time to such an advanced level that silver is permanently relegated to a 'barbaric relic' of monetary history? Or, does human action move in repeating cycles, with silver beginning to reemerge as a store of value after several decades out of favor?
I turn to the market for answers. Judging from the increase in investment demand, we can see that the metal is regaining a monetary premium. And while the growth over the last decade is impressive, it still amounts to only 200M oz. purchased worldwide every year.
What is the Potential for Investment Demand?
To put the size of the worldwide investable silver market into perspective, 200M oz. purchased per year equates to roughly $3.2 billion. The market cap of Apple Computer alone is over $600 billion.
Let us ask a few reasonable questions, keeping in mind the 200M oz. of silver currently available for investment demand:
- What would happen if each of the 100M households in the United States wanted to own 10 ounces of silver next year ($160 worth today)?
- With jewelry/silverware/industrial use sopping up over 80% of the supply at any price, where would that silver come from?
- Moreover, what if one billion of the world's 7.3 billion residents each wanted to own a single ounce?
The silver is simply not there at current prices. A major revaluation would have to occur should any additional significant demand come into the market.
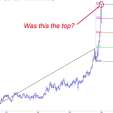
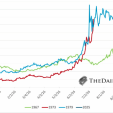
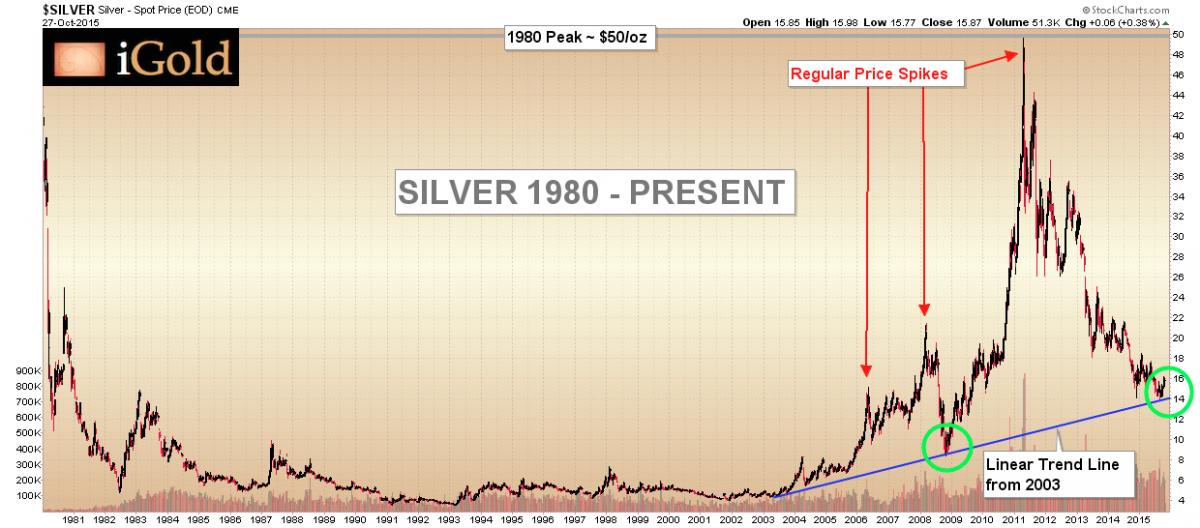
Turning our attention to a long-term silver chart, note the increasing price spikes every few years (2006, 2008, 2011) with a rising linear up trend line (shown in blue) acting as support. Amidst a rising mine supply and stable industrial/jewelry/silverware demand, it must be the physical investment demand that has caused these price spikes, as every few years a new wave of investors moves into the silver market.
Silver Price Projections
Our analysis is that silver is forming a long-term bottom in the $12-16 price range. From this bottom, the trend is clear: silver is regaining a monetary/investment premium after several decades of mostly fabrication use. That fabrication demand is inelastic. The investment demand for silver is what exists at the margin, and has been the primary driver in higher silver prices over the last decade. Economic cycles tend to move in waves over time, and when a small percentage of the world's population decides to invest only a tiny fraction of its combined wealth into silver, we anticipate the price will rise to a multiple of the current level.
Our initial 5-year target is a retest of $50/oz. This has been a multi-decade resistance level. Once this level is broken decisively, we anticipate it will act like a floor, just as the $850 level has for gold, the $1.20 level has for copper, and the $35 level has for oil. From there, we may reevaluate our thesis as fundamental factors warrant.
For those investors with at least a several-year time horizon and a tolerance for volatility, the opportunity in silver looks tremendous -- from a technical and a fundamental viewpoint.
********
share
share
share
share
share

Christopher Aaron began his career as an intelligence analyst for the CIA and Department of Defense. He served two tours to Afghanistan and Iraq between 2006 - 2009, conducting pattern-of-life mapping for military leaders.
Mapping shares similarities with technical analysis of the financial markets because both involve the interpretation of repeating patterns found in human nature. He is the founder of iGold Advisor, providing independent research and analytics on all aspects of the precious metals markets.
He speaks regularly on the cyclical patterns found within the financial markets and on international policy. He has been featured in the New York Times and NPR news amongst other financial publications.
More from Silver Phoenix 500