This Is How Bad It Really Is!


 The 1929 Dow crash marked the start of the infamous Great Depression. We currently have a repeat of the pattern that led to that great crash in 1929. This pattern is basically a huge stock market rally (after a period of stagnation) that is driven by a huge expansion of the money supply (or credit expansion). See the chart below (Dow chart from stockcharts.com):
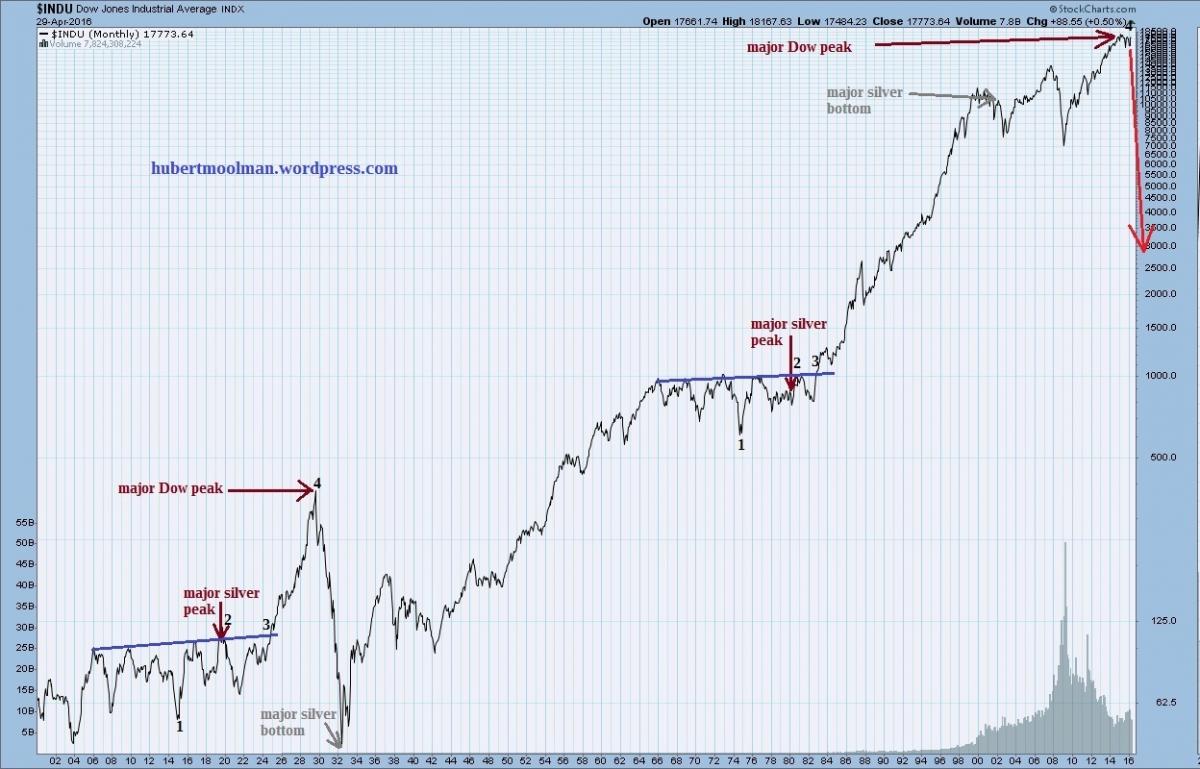
The period from 1906 to 1924 approximately represents the period of stagnation. The credit expansion eventually drove the stock market into a huge rally, which ended badly in 1929 (from point 4 to its eventual low in 1932).
So, just like the first pattern, we had a period of stagnation from about 1966 to 1982. Again, the credit expansion eventually drove the stock market into an even bigger rally, which is likely to end even worse (very soon).
Notice how both patterns exist in a similar manner relative to major silver peaks (1919 & 1980). This provides credibility to the patterns. In other words, it is very likely that the comparison is justified.
I have also indicated where the relevant major silver bottoms are. It is very significant that the 1932 silver bottom was after the 1929 Dow, whereas the current major silver bottom (2001) was before the May 2015 Dow peak. Furthermore, the recent silver bottom (December 2015) is very close to the 2015 Dow peak.
Given that Dow crashes are great drivers of silver rallies, this bodes well for the coming silver rally (more on this at a later stage). In fact, this is one of the reasons why the coming silver rally will outperform all previous ones.
********
For more on this and this kind of fractal analysis, you are welcome to subscribe to my premium service. I have also recently completed a Silver Fractal Analysis Report as well as a Gold Fractal Analysis Report.


