Inflation The Big Picture (Part 1)


One of the headlines this week was, the biggest rise in inflation since 1982. To put that into context we’ll need to look at some long term charts and what the Chartology looks like back then and today.
Right now everyone is trying to blame inflation on someone, regardless of the facts that I will present to you in the charts below. It is exactly the same thing when a Republican or Democrat is elected president. If a Republican is elected to the White House the Democrats will say they will ruin the economy and the same thing will be said by the Republicans if a Democrat wins, it never ends.
We are going to hear the same rhetoric over and over again with inflation because most people don’t understand the big cycles that move through the markets that can last many years. We are currently seeing that in the stock markets right now that have been in a secular bull market since the 2009 crash low. Since the 2009 crash low we have had one Democrat president and one Republican as president with a new Democrat president that has been in office less than a year.
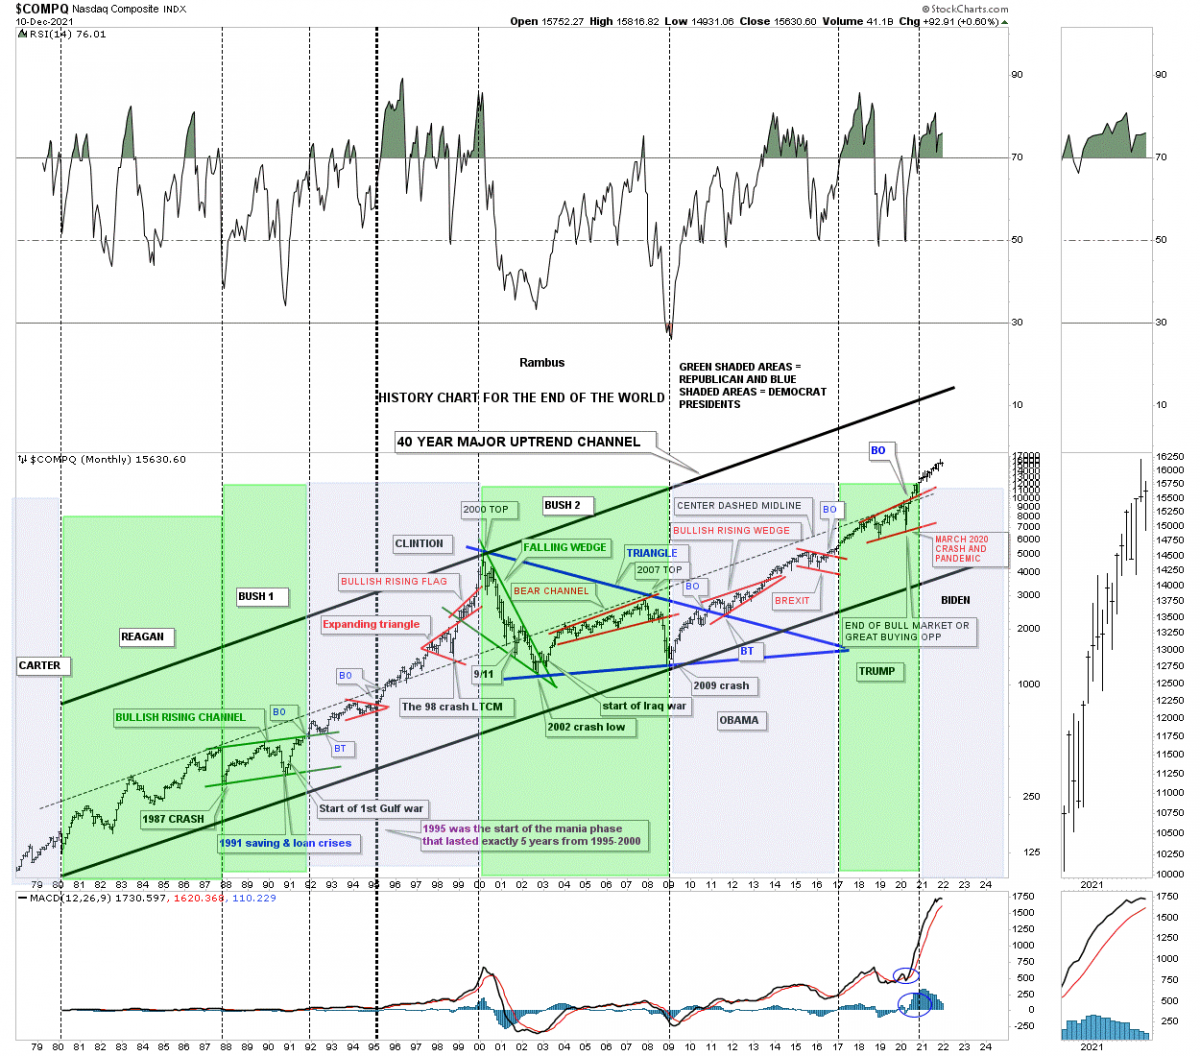
Before we look at tonight's charts I would like to show you a satirical look at the, HISTORY CHART FOR THE END OF THE WORLD. What this chart shows you are all the events over the last 40 years that felt like the end of the world if you were trading the markets when they happened. Many of you were members during the 2020 crash and got to feel what an end of the world event felt like that all of the other end of the world events felt like that never worked out for the bears.
If you recall on the day of the presidential election last year I made the BOLD statement that it wouldn’t make any difference who was elected president. By that I meant that the secular bull market that began in 2009 would continue unabated into the future and as you can see it has.
What this chart shows you is “REALITY” and not someones opinion on what the markets are supposed to do or have done in the past under a Republican or Democratic president, in living color. To show you what I mean look at the pink shaded area where Clinton was elected in 1992. He was elected on the breakout from the 4 year red bullish rising channel. There was a backtest shortly after he was elected which launched the 2nd half of the previous secular bull market into the 2000 high right at the very end of his presidency.
Bush 2 was probably the unluckiest president because he came into office at the end of the secular bull market in 2000 and left office at the very bottom of the 2009 crash low. I can assure you that it would not have made any difference if a Democrat was elected because the stock market ended a 25 year secular bull market in 2000 and needed to consolidate those gains before the next secular bull market started nine years later, note 10 year blue triangle.
Obama came to office at almost the exact bottom of the 2009 crash low. His presidency formed 2 red consolidation patterns during his 8 years in office. President Trump came to office on the breakout from the red bull flag in 2016. Four years after Trump was elected the COMPQ had formed another red consolidation pattern, the red bullish expanding rising wedge. To put an exclamation point on what I’m trying to show you, look at where President Biden was elected, right on the breakout from the red bullish expanding rising wedge.
It took millions and millions of traders trading billions upon billions of shares to create this chart below. You can believe the PPT created this chart by not letting the markets go down, but as you can see it didn’t work out very well as the markets experienced sharp corrections along the way. Distinguishing what is real for someone’s opinion is a very hard thing to do especially if you are not educated yourself. It is always so much easier to parrot someone else’s opinion than do the work ourselves to find the truth.
With this week’s headlines on inflation we can look to the charts to see if they can help us understand reality and not someone’s opinion. We are going to hear the experts say this is just a temporary bout of inflation and won’t last very long. There will be some experts tell us deflation is the real problem and everything is going to crash and burn. Who do you believe? Lets look at some Chartology to see what it may be suggesting is the real truth about inflation.
What is the PPI?
The producer price index (PPI) measures inflation from the perspective of costs to industry or producers of products. Because it measures price changes before they reach consumers, some people see it as an earlier predictor of inflation than the CPI.
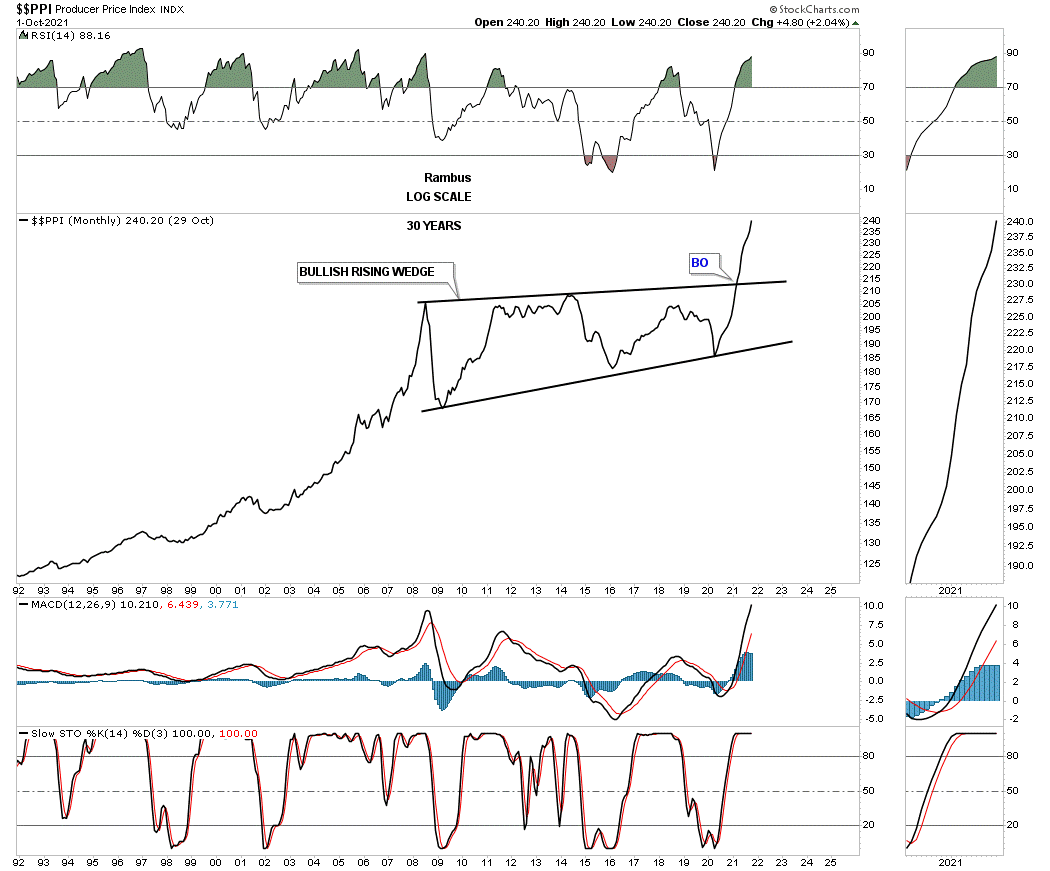
Lets start with this 30 year monthly line chart for the PPI. If we use the PPI as a measure of inflation we can see it has been fairly tame for quite some time by trading sideways since the middle of 2008. For the last 12 years or so the PPI has built a bullish expanding rising wedge with the last reversal point being the 2020 crash low. The breakout from that massive bullish rising wedge consolidation pattern came this year in March. This chart is strongly suggesting that inflation is really just getting started and will last for many years to come. Keep in mind there will be corrections along the way because nothing goes straight up or down in the markets.
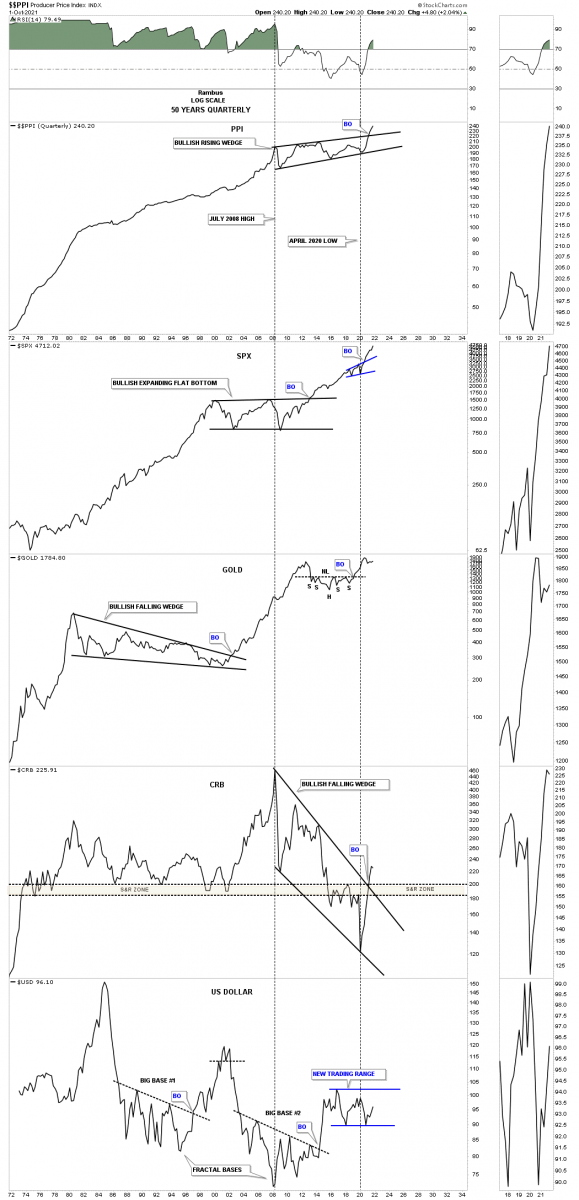
Next is the 50 year quarterly combo chart for the PPI which really puts the 2008 bullish expanding rising wedge into perspective. Below are some of the important indexes and how they did relative to the PPI over the last 50 years. Always remember big consolidation patterns leads to big moves which is clearly evident on this combo chart.
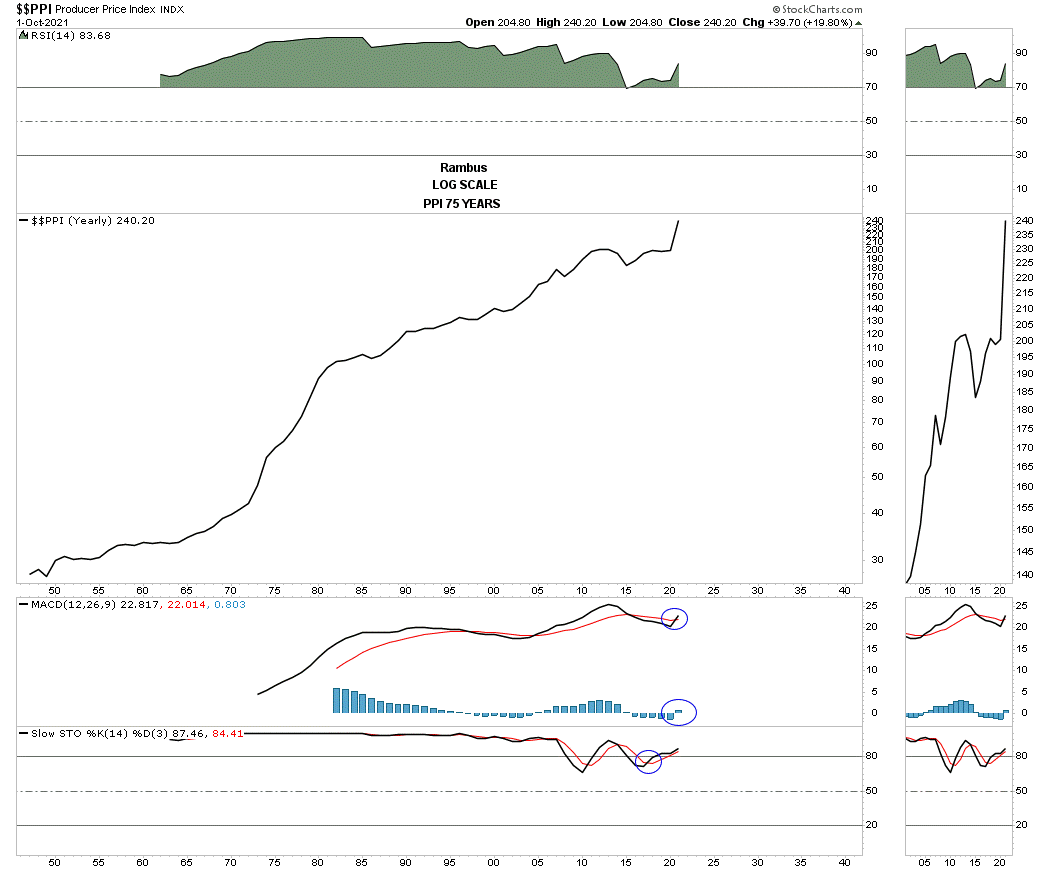
This last chart for Part 1 is a 75 year yearly line chart which shows the life of the PPI. It appears that inflation has been with us for a very long time and will continue to be with us to some degree in the future.
In Part 2 we’ll look some of the important commodity indexes to help shed some light on the inflation picture. All the best…Rambus
*********
 Rambus Chartology is Primarily a Goldbug TA Site following the precious metals markets. Chartology is the Unique Blend of Technical Chart Pattern Identification and Market Psychology, Developed by Rambus During the Tech Mania of the late 1990s. His Early Training came the old fashioned way...Reading Edwards and McGee's Bible of Technical Analysis and spending years with a sharp pencil graph paper and ruler refining his skills and accuracy. Visit the Rambus Chartology website at http://rambus1.com/.
More from Silver Phoenix 500


