Is Inflation Cooling And Putting In A Top? Could It Be That I Was Wrong?


To keep it simple: Nope! Not this time anyway. That is, however, what you hear from the wistful market makers who want to see last week’s CPI release as proof inflation was “transitory.” Let me disabuse you of that fantasy entirely.
Inflation took a breather. It didn’t fall. It climbed, but not as much as each month’s climb had been before.
It’s reasonable to think, if you are a mere surface scratcher, that the subtle decline in inflation’s rate of rise might mean inflation is already tiring. It’s also easy to think that inflation is putting in a top if you like to think that things are going to go the way you want them to go in order to keep yourself happy. However, a deeper look will completely dispel that notion because the forces that are causing inflation are nowhere near letting go of us.
First, the CPI numbers
Core CPI, which is the number you will see the Fed using all the time, versus the broader headline number, actually rose quite a bit at 0.33% added to tracked prices in just one month. To put that in perspective, if monthly inflation actually did stabilize at that level, it would still add about two more percentage points to the 2021 annual inflation rate by the end of the year (when compound each month) above the high number we already have in annualized inflation. So, the decrease in the rate of rise wasn’t much of a rest.
Energy leaped up 1.7% in just one month, and food prices jumped 0.7% over the month.
According to BofA – and judging by the market’s delighted kneejerk response – this month revealed significant cooling in transitory inflation. First on the goods shortages theme: used car prices edged up 0.2% mom, even though new cars were much stronger at 1.7% mom.
Due to the rapid rise in used-car prices in earlier months (up 41% for the year so far with new cars only up 6% for the year so far), some joked that we are seeing
an example of carbitrage, where “people buy new cars then flip them for profit as used cars.”
Medical care costs and owner-equivalent rent (the Bureau of Lying Statistics’ mischievous way of distorting the true cost of homeownership) each rose 0.3% month-on-month. Price increases in those categories tend to hang around once they rise.
While we added more inflation to a year that will already come in hot by year’s end, even if we added nothing for the remainder of the year, many price categories came in calmer than in previous months where each month has, up to now, been worse than the prior month. Thus, the sigh or reprieve in some quarters.
Another way of looking at this is with the following “heat map” for year-on-year cost-of-living increases, where (perversely in my way of seeing things) green equals hotter inflation and red equals cooler inflation:
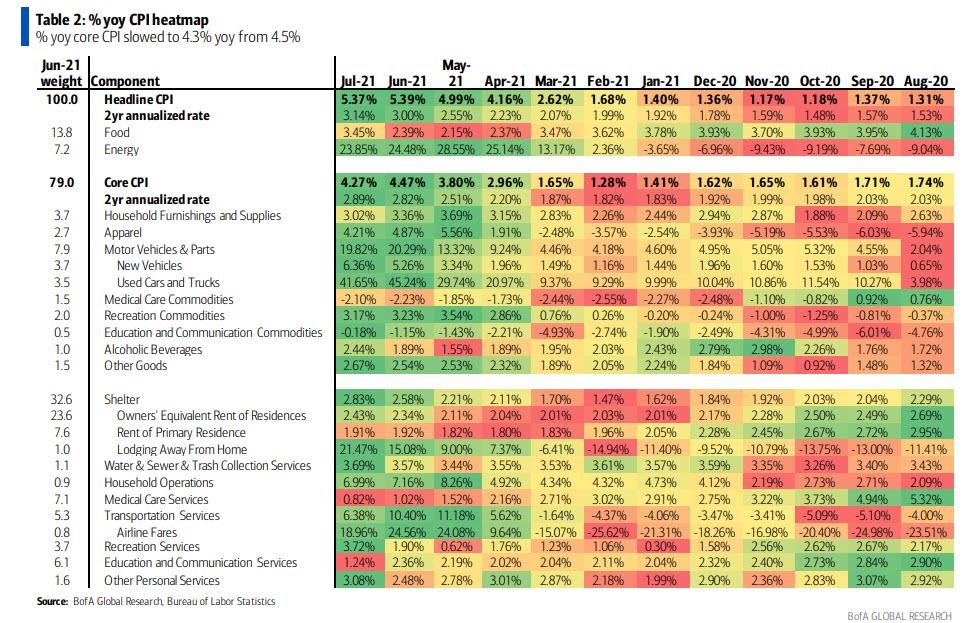
As you can see, the overall year-on-year inflation dipped a minuscule amount this month (from 5.39% to 5.37%), but the number of categories that are green (perversely signifying hotter inflation) in July are greater than any other month on the chart, including June! So, more things are rising now, but in aggregate they added up to a tiny bit less total year-on-year inflation. That means inflation is broadening.
Regardless, because the headline number took a tiny dip, the stock market seemed to breathe a little sigh of relief that maybe, just maybe, the Fed might not feel forced to tighten sooner, rather than later.
Time to call the “base effect” for the baloney that I already called it
There is one critical problem for supposing the ever-so-slight calm in inflation mean anything. The Fed’s own argument of the “base effect” now works against it. Remember the argument I’ve criticized over the past months, wherein the Fed said high inflation was mostly just a baseline effect in year-over-year numbers because we were supposedly comparing against months a year ago where we had seen deflation?
Did I tell you that argument would prove to be nothing once we crawled past those supposed dip months from a year ago during the lockdowns, which the Fed said were distorting our year-on-year inflation numbers to make them look worse than they really were? Well, here we are, we’re passing out of the dip in last year’s inflation that supposedly was the main reason year-on-year inflation looked so horrible, and, yet, July looks every bit as horrible as June with a headline number that is only 0.02 points lower than the last of the dip months. I guess that 0.02% was the total contribution of the base effect, since July is the month we put the comparison to the dip months behind us.
In one of my Patron Posts at the start of summer, I laid out a full argument for why the “base effect” based on the “dip” was meaningless. This baseline argument was used by the Fed and all who parrot whatever the Fed says, to support the argument that all of this inflation was transitory. Therefore, I showed how the mysterious dip in the prior year’s inflation, which was being used as an argument against current inflation, looked like this in a chart I presented: (Strain to see it. It’s the tiny circle to the far right.)
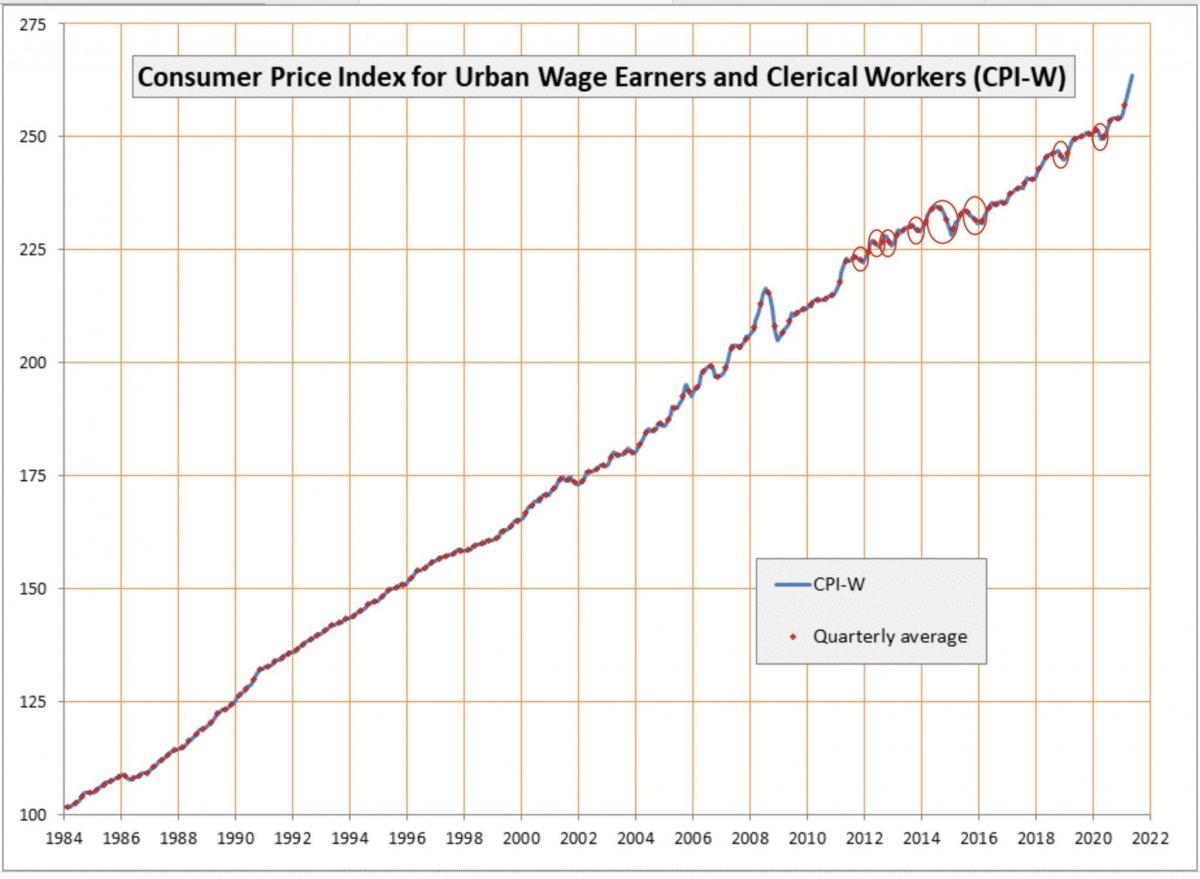
For those experiencing inflation in big cities, anyway, the previous year’s dip was entirely insignificant. As I wrote back in that June Patron Post,
As you can see by the numerous circles I placed on the graph after the big crash of 2008-2009, there have been many dips … since the Great Recession, some of them two or three times as large as the one in 2020, and NO ONE claimed the next year’s CPI percentage increase didn’t fully count because there had been a dip the year before!
This is the first time we are repeatedly hearing that rationale because 1) the Fed doesn’t want us to worry that inflation is as bad as it is right now, so it’s reaching for an argument it has never used; 2) the Fed did want us to believe it was coming close to its 2.0% increase each year in all previous years, which is why it never used this argument for all the dips along the way prior to now; and 3) no one else really wants to believe inflation is as bad as it is either. I call that “denial.”
“The Best Arguments Against ‘Persistent Inflation’ Have it Wrong“
As I showed in that article, the so-called dip months in 2020 — which were not so much a deflationary dip as just three months without much inflationary lift — were April through June:
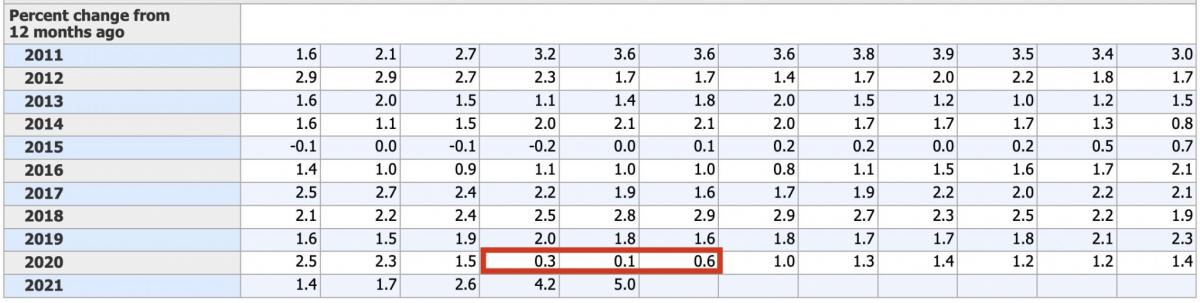
Now, July, 2020, was a little low compared to other months, too, but it wasn’t in the low months mentioned in the Fed’s “base effect” argument.” Notice, too, that the entire year 2015 was a “dip” if you compare it to the 2020 “dip” months (and it was a real dip, as in disinflationary some months, not just a slow in the rate of rise); yet, you never heard the Fed pull out the baseline argument to say inflation really wasn’t as high in 2016 as CPI indicated (because that was when the Fed was trying to hit 2% inflation and couldn’t get it up).
Likewise, you don’t hear the Fed mentioning the end of the base effect now that we see only the most minuscule dip in July year-on-year numbers as the “base effect” rolls off. So, to all of the baloney we were Fed up on, I will repeat now what I wrote in that Patron Post:
What I see as significant when I look at that graph above is not the almost invisible dip in early 2020, but the incredibly sharp rise ever since. Note that the only other time inflation rose as steeply as it has been rising in the past twelve months for as long as it has been rising during those COVID months was immediately before our global crash into the highly deflationary Great Recession. So, this kind of inflation may be “transitory” in the sense that it it will quickly transit us into a major deflationary crash, but that is precisely what I’ve been claiming — not that inflation will keep rising like this for years to come, but that it will rise until it breaks us.
In all things economic, there is rarely a straight line to anything, especially over a number of years. All upward trends have their dips and all downward trends have their blips; and the 2020 dip looks insignificant compared to other blips along the trail that we never talked about at all. So, can we stop talking about the nonsensical baseline affect that we have never talked about before?
By the end of the year July’s slight downward nod as we left the “base effect” behind will look like nothing more than a wiggle on the upward trend, since that is all the difference we can see now between base-effect months and other months.
Will July’s calm really mark the end of the inflationary storm?
One other little problem for the relaxed view that thinks inflation if fading, besides the roll-off of the “base effect,” is that the price categories that saw a lower rise this month than last are still rising, having already doubled or tripled annualized inflation in six months.
However, a much bigger problem is that many of the softer prices in last week’s CPI print were in goods or services that do tend to be transitory, while some goods or services that tend to be persistent rose at a faster rate. To see what is still coming in inflation we need to look at what is happening in categories where price changes are definitely more persistent, as I have done in number of Patron Posts along the way and will now do in this article for everyone.
Housing inflation
To start out with, I’ll note that owner housing costs — as guessed at by the BLS via surveys that ask how much a homeowner thinks they can rent their house for — have barely increased to 2.43% year on year! We all know that number is absurd as is the data point that shows rents are up only 1.91% from a year ago. As I said in a recent article covering this inflationary factor, housing price increases that have already happened have not even begun to factor into the CPI data due to forbearance rules as well and due to how CPI calculates the housing category in ways that significantly delay the reported increase. So, there is a lot of actual inflation to play through that has already happened in the real world but doesn’t show up yet in BLS stats.
You see, higher prices for houses have to first become higher rental prices from landlords to renters (due to landlords paying more to buy the houses and paying more in property taxes) before they can become higher prices for houses under the BLS’s “Owners Equivalent Rent of Residences” category, which is based purely on that B(L)S survey of what owners think their houses would rent for. After all, how can an owner guess what his new house would rent for (as if owners even pay attention to rental rates) when the year-long rise in new house prices has not even impacted rents yet due to forbearance rules keeping most rents locked in place?
So, this area of CPI will take months and months, as I wrote in July, to reflect the price increases that already happened in the real world. Yet, look at what just happened in real-world housing prices, regardless of what CPI errantly shows:
Home Prices Soar At The Fastest Pace On Record As Affordability Hits All Time Low
…Today the NAR [National Association of Realtors] reaffirmed that US home prices are rising at the fastest pace on record, with the median price of an existing single-family home soaring 22.9% in the second quarter from a year earlier to an all-time high of $357,900….
The result was an increase in existing home prices in all but one of 183 measured markets during the second quarter of 2021….
U.S. housing has never been more unaffordable.…
Just how unaffordable is housing? Well, among first-time buyers, the mortgage payment on a 10% down payment loan jumped to 25% of income (21.2% one year ago)….
Oh and for those hoping to escape the hyperinflation in the housing market by renting, sorry – you are out of luck: rents are also soaring at the fastest pace on record!
CPI has a lot of catching up to do just to reflect what has already happened. That is inflation in the bag that just hasn’t been reported yet. Of course, the BLS will reduce its highly inaccurate survey number down the road with adjustments to minimize the truth as much as possible; but there will still be truth seepage that makes its way into the BLS numbers over the months ahead because, if the B(L)S numbers don’t somewhat rise with the truth, the numbers will become unbelievable to all (as they should already be).
Meanwhile, rising home prices and scarce availability of homes for sale are pushing more and more people into becoming renters (now surpassing previous record levels):
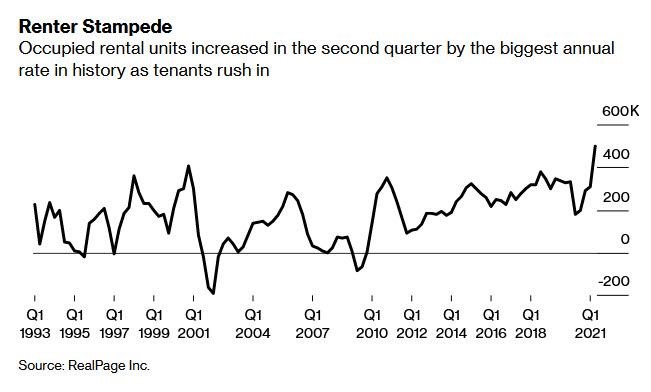
The largest surge in rent in months is coming from people who are newly entering the rental market (whose rates are not, therefore, frozen by forbearance) even as they barely show up in CPI … so far. Wait until forbearance ends (if the government ever allows a free market in rents again) to see what happens to rents once the following kinds or restraint are finally lifted:
It’s hard to raise rents on existing renters with such frightening restraints firmly in place against landlords. If you raise rents, your renters won’t pay them, and you can’t get your renters out if they just stop paying altogether. So, there is tremendous inflation already in the pipeline there, waiting to emerge as soon as the government plug is pulled.
Producer price increases
Throughout the latter half of 2020, I wrote that inflation being seen on the production side of the economy would eventually make its way through to the consumer side (CPI). So, I regularly tracked the Producer Price Index (PPI), particularly for my patrons. The increases there took well over half a year to become reflected in prices passed along to consumers because producers had a lot of inventory they could still sell at a profit without raising prices because they had made the inventory when their own prices for materials and parts were lower. Because most producers have now burned through their inventory, producer price increases experienced now will pass through to CPI much more quickly than before.
As with housing, today’s producer price increases have yet to be reflected in consumer price increases. So, CPI will certainly be adding them in as those increased costs get priced along in a world where there is little to no inventory left to act as a buffer.
After soaring to a record high 7.3% YoY in June, PPI was expected (like Core CPI) to moderate modestly in July to ‘just’ +7.2% YoY. They were wildly wrong as July’s PPI soared to a new record +7.8% YoY (up 1.0% MoM)…
And that looks like this:
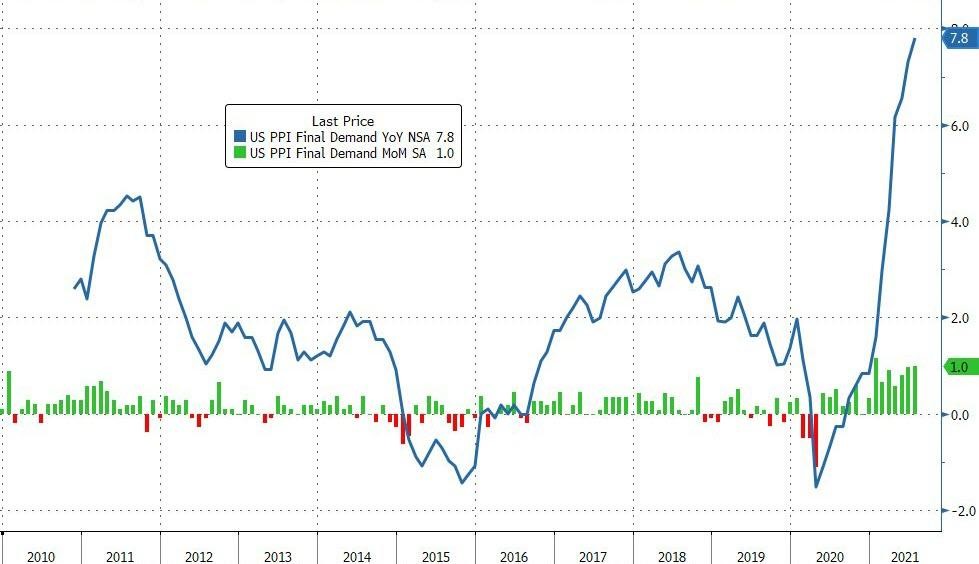
Just when it looked like inflation on the producer’s cost side might be starting to round off, it leaped up again. And this, of course, is not just how inflation moves along to the consumer but is how inflation can potentially damage the stock market (even without causing a Fed taper) by squeezing profit margins, something some individual investors still pay attention to when they buy individual stocks. To avoid that potential peril, producers will increasingly pass along these costs as they no longer have the inventory to buffer their increased expenses, which are due to all the supply-chain troubles we will be coming to. If they cannot pass the increases along because consumers can’t absorb more inflation, producers will run in the red, and that will damage their stocks. So, either PPI raises CPI more, or the rise in PPI starts to tear at the market’s underbelly by taking profits down to nothing or even into losses. So, either way, inflation will do its damage.
It’s true for services, too:
The index for final demand services rose 1.1 percent in July, the largest one-month increase since data were first calculated in December 2009.
And, if you think those product shortages you’re likely seeing on the shelves now will be going away soon (shortages are a major driver of higher prices), look what manufacturers are looking at as they set their production calendars:
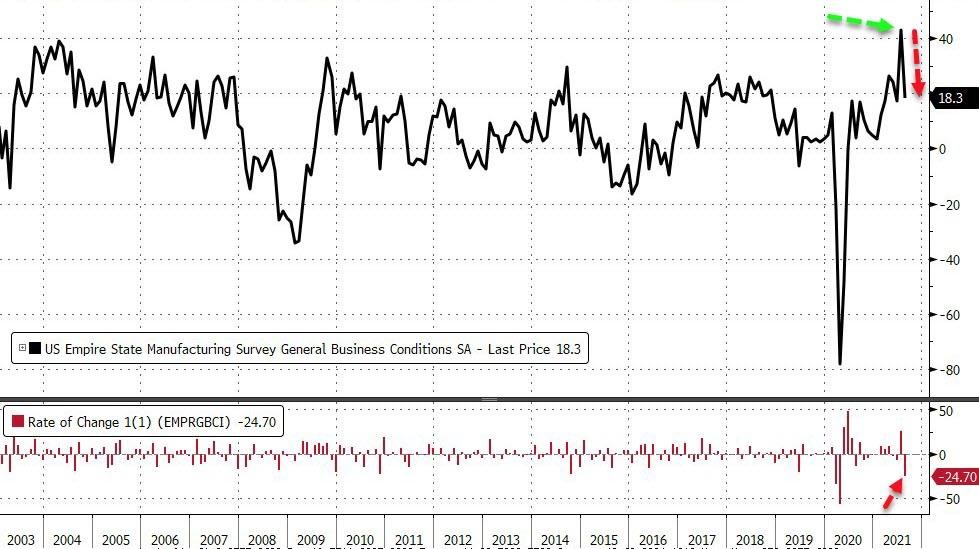
The Empire State Manufacturing Survey shows business conditions have crashed toward the zero bound by more than half (from 43 to 18.3).
As ZH put it,
massively missing expectations of a drop to 28.5.
It’s the biggest plunge ever with the exception of what happened when we fell into the COVIDcrisis lockdowns, and part of the plunge in business conditions was due to the serious rise in prices that producers are facing. Prices are up, even as demand is falling. Sound like stagflation to you?
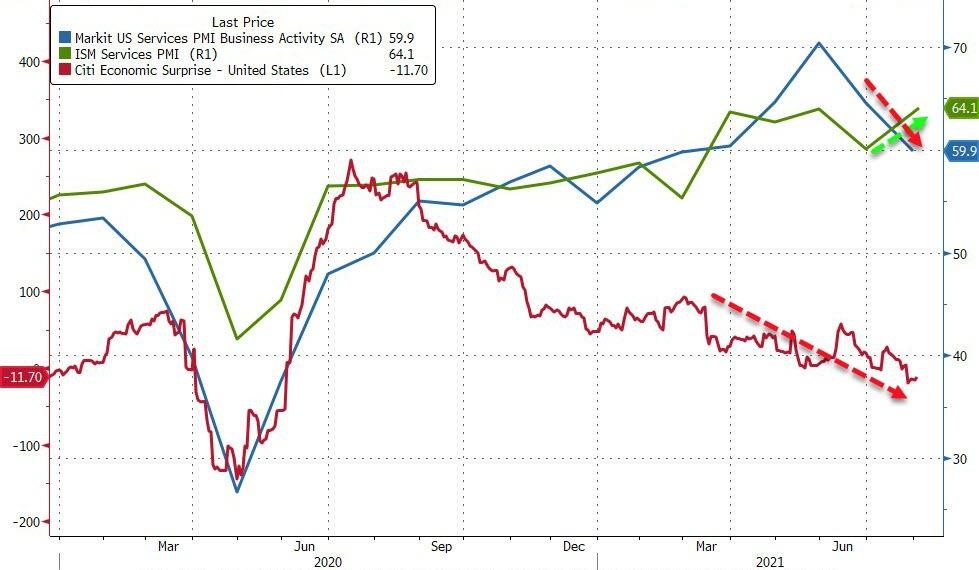
Facing that, you’d be more inclined to slow production than increase it. Thus, business activity has taken a big hit, while economic surprises have been running increasingly to the negative side for months. There is not a lot of “transitory” news coming in.
In yet another sign inflation might not be transitory, over 85% of manufacturers reported increasing prices in July in the most recent manufacturing ISM report…. CPI has already come in hotter than expected every month this year.
Inflation, I’ve said since last year, would be the big story to watch.
A big part of those rising costs is rising labor costs, and it’s hard to roll those back once you’ve put them in place, even if the labor pool grows after all the unemployment supplements end in September — IF they end, given they’ve been rolled along at the last minute several times now. I think they will end because the government is reaching its limit on finding willingness in Congress to extend them.
The weakest link in the supply chains — shipping
One of the Fed’s biggest excuses for claiming inflation would be transitory was that most of it was based on COVID-related supply chain problems that would supposedly go away as the recovery took hold. I laid out earlier in the year in regular posts and Patron Posts the many reasons why those supply-chain problems would not be going away anytime soon (and did not even get into the possibility that COVID, itself, might not be going away soon). Now we can readily see that many of those supply-chain bottlenecks the Fed referred to are actually worse as we start to close out the summer than they were when the Fed made that delusional claim.
Shipping is feeling the pinch, and that is one of the other big cost increases manufacturers are facing.
Anecdotally, I experienced the shipping logjam just this past weekend in a way that felt almost apocalyptic. Having dinner at a friend’s house that overlooks a bay, I saw two large container ships anchored. One, was empty, judging by his high waterline, and the other full. “So what?” you might say. This is a bay in which I have never seen container ships anchored, and where I lived and played for years. Its little port has no facilities for loading and unloading such ships. That meant the container ships were parked there waiting to get moorage most likely in Seattle, some one-hundred miles away. That’s a long backup!
I asked my friend about it, and she said she’s never seen this before either until recent weeks where it has become the new norm.
There is nothing the Fed can do about the nation’s backed-up ports, nor the government. The shipping problem is global. Ships, for example, are backed up because large Chinese ports have closed for business due to COVID lockdowns.
Shipping will need to start to make contingency plans if cases of Covid-19 continue to escalate in China, the world’s most important nation for shipping movements…. The delta variant has broken through the country’s virus defenses, which are some of the strictest in the world, and reached nearly half of China’s 32 provinces in just two weeks….
When a Covid-19 outbreak was detected at Yantian Port in late May, operations at the key southern Chinese export hub were slashed by 70% for most of June. Similar disruptions are on the cards in the coming weeks, while shipyards are also likely to see their delivery schedules come under pressure if any wider lockdown measures are taken….
“Cargo owners, already stressed beyond sanity from devastatingly high freight rates and absurd surcharges, and with no way to secure neither equipment nor space, would suddenly see their procurement costs sky-rocket in addition to their back-breaking logistics costs,” Murphy predicted….
Many ports in the country are also requiring vessels to quarantine for 14-28 days if they previously berthed in India or performed a crew change within 14 days of arriving in China.
*********

David Haggith started writing about the economy after he predicted The Great Recession half a year before it hit and was puzzled as to why no economists or stocks analysts saw it coming. In the months after the crisis broke out, he started to write humorous editorials in a series titled “Downtime,“ which chided the U.S. government and bankers who should have seen the economic collapse coming but whose cronyism, greed and ineptitude caused them to run the world into a ditch. Those articles were published in The Hudson Valley Business Journal, The Valley City Times-Record (North Dakota), and The Daily Herald in Tennessee. Haggith is dedicated to regularly criticizing the daily news — not just the content but the uncritical, unthinking nature of almost all of the reporting. He now writes his own blog, The Great Recession Blog, to break down the news as an equal-opportunity critic toward both Republicans and Democrats / Conservatives and Liberals … since neither kind of politician has done anything worthwhile to plot a better economic course. His articles are regularly carried by several economic websites.
More from Silver Phoenix 500


