June 26 Silver Flash Crash: A Forensic Analysis


On Friday morning, at around midnight (Arizona time), the price of silver had a little crash. It dropped 30 cents in 11 minutes. More importantly, it dropped more than 10 cents in a single second. Then, the price rose above its level before the event. Here is a graph of the event, with each tick representing one minute.
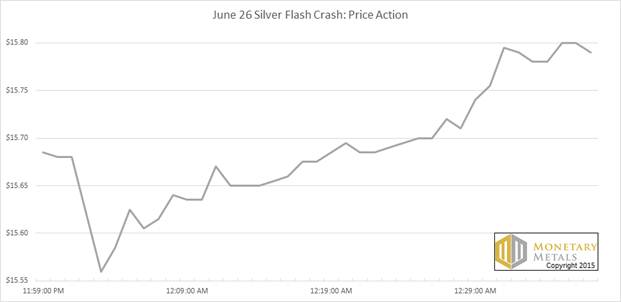
Figure 1: Silver flash crash price action
Let’s perform a forensic analysis of this mini flash crash.
Zooming in to the event, here’s a look at the bid (green) and ask (red) prices for the September silver future for the period around the crash (which occurred at 12:03am AZ time). On this graph, each tick is one second. We used dashed lined to show bid and ask prices on the September future.
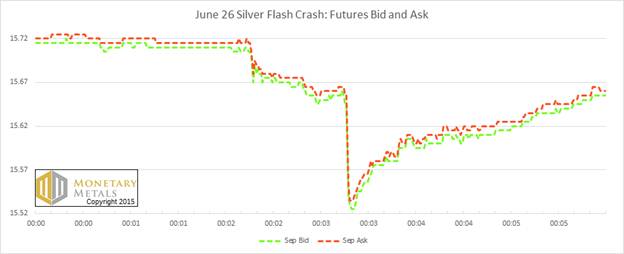
Figure 2: The bid and ask prices of the September silver contract
That vertical drop occurs largely between one second and the next, 12:03:16 and :17 (AZ time). It slides a few pennies over the next two seconds, and then it’s done.
We’re very aware of the widespread belief that there is a conspiracy to manipulate downwards the prices of gold and silver, for nonprofit and for profit. This conspiracy is supposed to protect the dollar and/to make money (and by money, it’s meant dollars). We know that many folks are firm in this belief.
However, bear with us as we show you the data to support a different theory, an arbitrage theory. The bullion banks are not betting on the price of gold or silver. They are performing arbitrage, profiting from the spread between spot and futures (and other markets), and are largely agnostic to price (though we assume that they, like everyone else, make occasional bets on silver, in their proprietary trading).
Everyone agrees that futures are a strictly zero-sum game. In each contract, one party is long and the other short. If the price goes up, the long wins (dollars). If it goes down, the short wins. This is why it’s easy to assume that the bullion banks are making a bet on the downward price. In fact, they are not. They are arbitragers, carrying metal. That is, they buy spot and sell futures (and sometimes the other way around).
Many analysts call this hedging and ask rhetorically: “why would they hold such large positions, just to hedge?” We say it’s not hedging, but arbitraging. They are making a small spread on every ounce of metal they carry. Carrying, as distinct from owning, is when one merely holds metal for the benefit of the contract counterparty.
To see the bigger picture, let’s look at this chart of the price of crude oil, during the same time window as the silver price chart at the beginning of this Report.
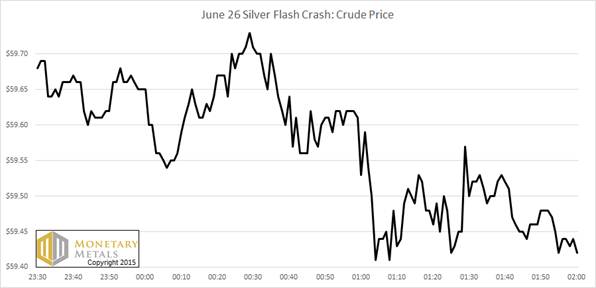
Figure 3: The price of crude oil around the silver flash crash
The low price in crude occurs three minutes after the price of silver hit bottom. While the correlation is not perfect, it does suggest that larger forces were at work on Friday, forces outside the scope of the silver market. We’ll get back to this topic of what those larger forces may be, below.
The crude oil price didn’t move as much as the silver price. Although unlike silver, oil spent the next half hour sliding and ultimately hit a low about 20 cents further down.
Now let’s look at the September future again, this time with the bid-ask spread overlaid.
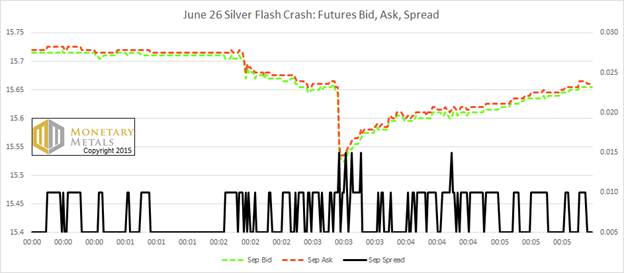
Figure 4: September contract bid and ask prices, with bid-ask spread
The spread is consistent, only widening—to a penny and a half, from the normal penny—a few times during the worst 15 seconds of the event. This is a testament to the market makers. As we shall see below, heavy selling of the contract pushed down the price. This means each seller took the best available bid, and the next bid taken by the next seller was lower. Observers see the tape of cleared prices going down, but in a live market, mechanically it’s the bid being pressed down. If the market is operating efficiently, the market makers bring down the ask price commensurately. If sellers were truly running away with it, the market makers couldn’t keep up and would withdraw. Then the bid-ask spread would widen dramatically (not what we see here in the September silver future).
Whenever a major price event occurs, we’re interested to know if it’s driven in the futures market, and thus likely leveraged speculators, or in the spot market. Here is the futures and spot prices, including bid and ask. We’ve zoomed in to a very short time window around the main price action, so you can clearly see what happens first and what happens after.
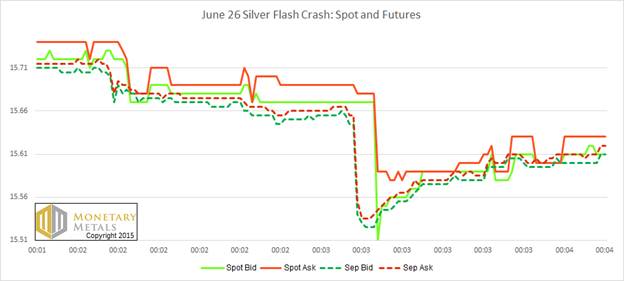
Figure 5: Spot and futures, bid and ask prices
The selling began in futures.
The spot market begins dropping 5 seconds later. Note that the spot bid price overshoots. The ask price holds at $15.59, but the bid price doesn’t stop until $15.51. An eight cent spread is not normal.
Speaking of which, here is a graph showing the bid and ask prices, along with the spread for the silver spot market.
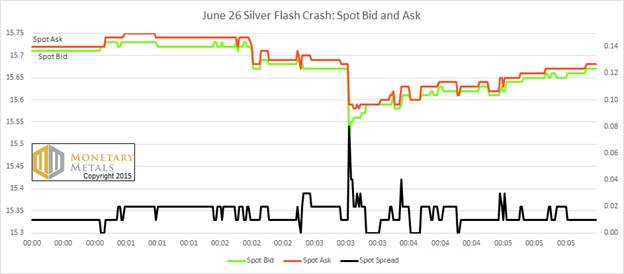
Figure 6: Spot bid and ask prices, with bid-ask spread
The market makers in the spot market can’t hold the spread as tight, during a major event, as in the futures. Before and after, we see a one to two cent spread (which is about twice as wide as in the futures market). But during the plunge, it spikes to eight cents before hovering around three cents for six seconds and then going back to normal (with one more spike).
Spot silver is less liquid, and therefore harder to make a market in, than futures silver. That said, it’s important to note that, aside from a few seconds of panic, everything remained orderly. There was a big selloff event, and the market held together.
Now we can piece together the chain of events:
- Selling began in silver futures
- This caused an abnormal plunge—ten cents in one second
- The market makers—who are arbitragers—responded normally
- The bid-ask spread in the September contract never expanded beyond $0.015
- After a noticeable delay—five seconds—the spot market begins selling
- The pressure in the spot market is on the bid price
- Normal bidders in the spot market may have pulled their bids for a few seconds
- The bid-ask spread blew out to eight cents—4X its normal level
- The market makers do get the bid up, a few seconds later
- We can clearly see the ask on spot refusing to drop below $15.58 to $15.59
Let’s discuss item #10 for a moment. For years, we have been arguing that nothing that happens in the futures market can force stackers—who are unleveraged—to sell their metal. In this case, it didn’t matter that there was a temporary period when the best bid on the metal is $15.51. No matter, no one offered to sell below $15.58.
Bidders can withdraw, while they await the action to play out. But no manipulator can force stackers to unload or lower their ask price. At most, a manipulator can scare some holders of metal to sell. What kind of holder of metal can be so scared? Only a dollar thinker—someone who holds metal in the hopes it will go up in dollar denominated price—can be scared. He can be scared, in the fear it will go down in dollar denominated price.
Those alleging manipulation may claim to believe gold and silver are money. However, their very allegation betrays their true belief. They think of the value of gold and silver as measured in dollars.
This is not to say that there are no leveraged traders in the spot market, or that all owners of metal are stackers. The point is simply that owners of metal are under no compulsion to follow the action in the futures markets. A big selloff in the futures market does not obligate you to sell. Additionally, it may give you a chance to buy. This is likely part of the explanation of why the ask price in the spot market remained elevated. Buying would lift the ask price. If this occurred, then there was downward pressure on the bid and upward pressure on the ask. No wonder the market makers couldn’t hold it together.
Wait… why was there downward pressure on the bid?
Another arbitrage. When the price of a future plunges, then there is an opportunity to make a risk-free profit. The opportunity is open to anyone who has metal. You can simultaneously sell metal and buy a future. This is called decarrying.
Here’s a graph of the decarry spread in silver. This is the raw profit on the trade (as opposed to the cobasis we normally plot, which is an annualized percentage). The decarry is Spot(bid) – Future(ask). We have cut off everything below zero, as we want to focus on the profit opportunities.
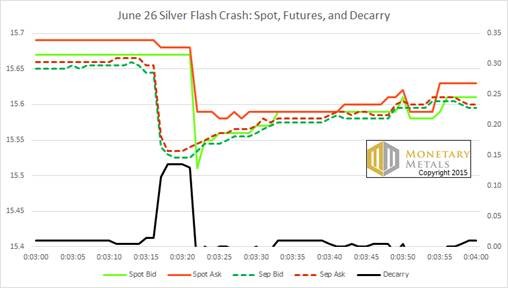
Figure 7: Spot and futures bid and ask prices, with decarry spread
The decarry hits a peak of 14 cents, which is almost 1%. This is a position that’s guaranteed to close by the end of September, or at most three months. 14 cents represents almost 4% annualized, and there’s no (conventional) risk.
Of course arbitragers took it!
That’s what corrected this extraordinary situation. They could sell their spot metal, and buy a contract to recover exactly the same position. Selling spot presses the spot bid, and buying futures lifts the future ask. It is interesting that the decarry was lower, after the flash crash. This shows the fingerprints of the decarry arbitragers.
Contrast this action to the bargain-hunters who saw spot drop and thought to pick up some more metal at a discount. Those folks are lifting the ask price. The result of this battle between those selling on the bid and those buying at the ask price is write large in Figure 6, above, with the spot market bid-ask spread blowing out to eight cents.
Then, it’s over. The arbitragers, including the market makers, get everything under control. Selling of futures pushed down the bid price of futures. Market makers kept the ask price within a penny and a half of the bid price. It took a few seconds for arbitragers to react to the blowout in the decarry spread. Then they pounced, selling metal and buying futures. This pushed down the bid price of spot silver and pushed up the ask price of futures contracts. Bargain hunters also jumped in, buying spot metal and lifting the ask price on spot. It took longer, but market makers in the spot market got it under control, and the spread compressed back to its normal penny or so.
As we know in hindsight, the buying continued and the silver price peaked a few hours later 10-15 cents higher than before the event.
We have the basis data from Friday to see what happened to supply and demand. The cobasis (i.e. scarcity) fell. The cobasis was lower on Friday (after this flash crash) than on Thursday (before). This is notable, as the price of silver was lower.
The run of buying after the flash crash was futures, as speculators yet again were lured in to the market to buy that dip, greedy for the inevitable price increase. We suggest it’s not so inevitable, or at least not imminent.
This is a bad news, good news scenario. The Bad news is that by our calculations the fundamental price of silver—when we back out the impact of the speculators—is under $15.40. The Good news is that the fundamental price is up a nickel on the week.
Earlier, we referred the idea of larger forces that could force market participants to liquidate positions, i.e. deleverage. The obvious one right now is the seemingly imminent Greek default. As of this writing, on Sunday afternoon Arizona time, the headlines announce that Greece has imposed capital controls and will ask voters whether they want a bailout or whether they want to stay the course of default. The euro, S&P 500 futures, crude oil, and other markets were down in price dramatically, at open.
Debt default is how we think of deflation. Of course, default puts creditors under pressure because they are typically leveraged. They must keep their leverage to a certain ratio, and the sudden loss of an asset pushes the ratio up. Worse yet, some assets are hard to sell, because they’re illiquid even in better times. So they often turn to liquid commodities and the monetary metals. As we see, the bid-ask spread doesn’t get very wide, even under extreme pressure, nor remain wide for more than a few seconds.
We make no predictions about what will happen with Greece in the coming weeks. However, we do see the likelihood of continued volatility in silver (it’s worth noting that a flash crash occurred on Friday June 19), and the strong possibility of another durable drop in the silver price.
Friday was the fourth time in a week, that we see icicles in the hourly silver candlestick price chart. The last time we noted them, the price dropped over $4 within about two months. The difference is that, back in July 2014, the fundamental price was about $4 under the market price. Now it’s more like $0.35 under.
Be careful out there.
********
Monetary Metals publishes a free weekly Supply and Demand Report covering the gold and silver markets. If you value this kind of analysis and market data, click here to subscribe.
 Dr. Keith Weiner is the CEO of Monetary Metals and the president of the Gold Standard Institute USA. Keith is a leading authority in the areas of gold, money, and credit and has made important contributions to the development of trading techniques founded upon the analysis of bid-ask spreads. Keith is a sought after speaker and regularly writes on economics. He is an Objectivist, and has his PhD from the New Austrian School of Economics. His website is www.monetary-metals.com.
More from Silver Phoenix 500


