The Last Contango Basis Report


The “coordinated smash down of gold and silver” was on everyone’s mind this week, but is it true? Did the price of paper gold (futures) divorce from the price of physical gold? One thing is for sure, the dollar gained from 21g to over 22g of gold on Friday. A 5% move in the world’s biggest paper currency is a big move.
We have long been predicting volatility as the paper monetary system goes off the rails. Those with their balance sheet in gold can safely watch. Just as most dollar-based investors do not lose sleep if a stock is rising that they don’t own, gold-based investors do not lose sleep if the dollar is rising. But those who borrowed dollars to buy gold are sweating…
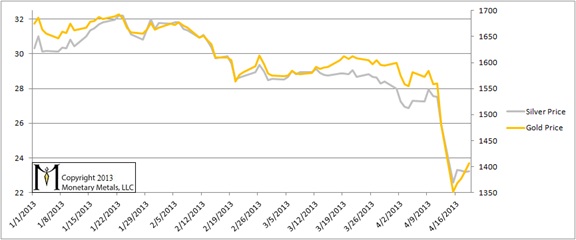
Here is the graph showing the prices of the metals in dollar terms.
Gold and Silver Price
One cannot understand the gold market in terms of the quantity of dollars the Fed “prints”, nor by looking at price charts. One must look at the basis (see here for a basic explanation). Week after week, we have been saying that the positive basis, i.e.contango is disappearing (hence the name of this report). This is a process of gold withdrawing its bid on the dollar. One cannot understand this if one lives in the dollar bubble, looking at the gold “price” as if it were comparable to the wheat price or the Mercedes E500 price. What would a falling gold “price” mean? The gold “bull market” is over? And when it rises, does that mean sell to take “profits”?
In this report, we have been tracking the temporary backwardation in both metals.
The cobasis in the June contract fell below zero; it went out of backwardation. This means that a big part of the price drop was driven by owners of gold metal selling (perhaps to cut their “losses” measured in dollars). After the big plunge, the cobasis began rising along with the price, showing that the price was rising due to buying of physical metal more than futures (more on the futures below).
Gold Basis and Cobasis

In the gold chart, we’ve marked the place where, rumor has it, 500 tons (assuming this is Imperial tons, it would be 16.3M troy ounces or 163K gold futures). According to the rumor, the price of “paper” gold was smashed down but physical gold has strong demand. It’s hard to interpret magical thinking, but if we were to take a stab at it, it should mean that physical gold is still trading for $1600 and only “paper” gold is now $1400.
There is a technical term for this, that some readers may have seen somewhere along the way: backwardation. If the June contract were at $1400 and physical gold were $1600, that would be a $200 profit to decarry (i.e. sell physical and buy a future) which would be 12.5% in about two months, or about 75% annualized.
Back in reality, the cobasis did not rise; it fell. Below zero. Now it has risen above zero again (though the magnitude is still a fraction of 1%, annualized).
Here is the basis chart for silver. We have included both May and July futures, as traders are rapidly closing May and moving to July.
Silver Basis and Cobasis
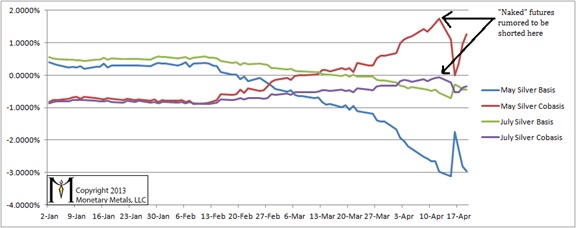
We marked the points at which the alleged massive “naked” short supposedly knocked the price down. As with gold, the cobasis fell.
Unlike in June gold, in May silver we now have the dynamic of the contract roll. Those who have naked positions must close those positions. Longs must sell. Shorts must buy. If there were a significant short position, this would drive up the ask in the contract.
Cobasis = Spot(bid) – Future(ask)
A rising ask on the future would cause the cobasis to fall during the roll process. Yet we see a rising trend in the red line until the crash and it has begun rising again. Everyone has to make up his mind whether he wants to believe in the tooth fairy, Santa Claus, and the Vampire Squid who shorts gold and silver “naked”. All we can do is provide the evidence. Santa would not fit into the chimney of a wood fireplace nowadays, much that of an oil burner.
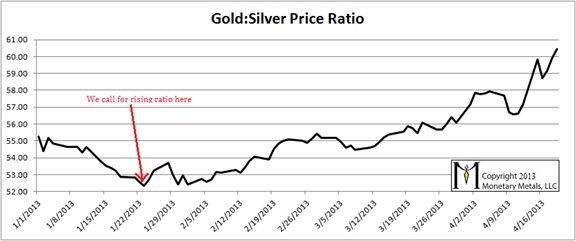
Here is an update on the gold:silver price ratio. It ended the week at 60.5.
Gold to Silver Price Ratio
Here is the graph of the open interest in the metals. The rumor claims 163,000 gold contracts (and presumably an equivalent number of silver) were sold where the arrows indicate. All in all, we see about a 16K drop in open interest in gold, and about 12K in silver.
Open Interest in Gold and Silver futures contracts on COMEX
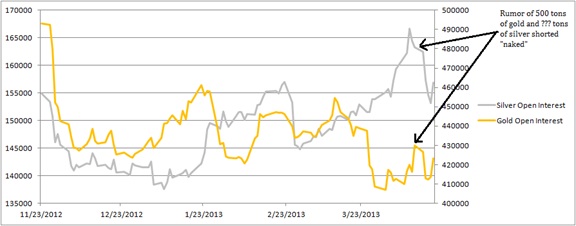
If someone had sold 163,000 futures to cause the price to drop, then wouldn’t the open interest have risen? If Santa went down chimneys, wouldn’t there be soot on his red and white uniform?
********
If you found this information to be useful, you can sign up (free) to get automatic notification when new reports are published.
 Dr. Keith Weiner is the CEO of Monetary Metals and the president of the Gold Standard Institute USA. Keith is a leading authority in the areas of gold, money, and credit and has made important contributions to the development of trading techniques founded upon the analysis of bid-ask spreads. Keith is a sought after speaker and regularly writes on economics. He is an Objectivist, and has his PhD from the New Austrian School of Economics. His website is www.monetary-metals.com.
More from Silver Phoenix 500


