London Property Bubble Primed To Burst - Consequences For UK Economy And Sterling


The ongoing slump in oil prices looks set to take their toll on London’s “super prime” property markets with attendant consequences for the rest of the London property market. Foreign money that had been flooding into the UK from a whole array of international sources and parking in London real estate is drying up.

These sources included Chinese billionaires and U.S. beneficiaries of the Fed’s QE largesse and Russian and Middle-East energy tycoons.
Western sanctions on Russia have led to a shuddering hault to Russian money entering the UK. Since Xi Jinping came to power in China in November 2012 there has been a crack-down on corruption in China and the amount of Chinese cash being funneled through tax-havens and into London property has been greatly reduced. The Fed’s QE has come to an end, for now at least, so U.S. sources of capital have waned.
Now the plummeting oil price is leading to a drop in demand from wealthy Middle Eastern elites. Many Gulf States are having difficulty financing their social programs due to the very low price of oil. Control over their countries restless populations is becoming more tenuous. So providing “bread and circuses” is a higher priority than pet investment projects in the UK.
The loss of these investment flows to the UK is creating a perfect storm for a crash in “super prime” property.
According to a report from City AM - citing statistics from Halifax and Britain’s ONS - since 2009 certain sectors of the British property market have fallen by as much as 20% (most of Scotland and Wales and parts of northern and south-western England) while others (in pockets of central London) have risen by as much as 61%.
The median UK wage is £22,044. This sum of money would currently buy 2 square meters of real estate in the plushest London boroughs of Kensington or Chelsea. Spreading out from the centre to Brent, Merton, Greenwich or Waltham Forest the same sum will yield slightly more space at between 5 and 6 square meters. On the other end of the spectrum - in parts of Wales, such as Merthyr Tydfil, the median wage would acquire 24 meters squared.
Central London has generally seen a rise in prices of between 40% and 60% in the last six years. Southern England has mainly seen rises of between and 15% and 30%. Whereas south west England has seen declines of around 4% in the same timeframe - with West Devon losing 13% of it’s property values.
In Wales there have been modest declines in some areas (1 -5%) and more severe in others (down 10% in Swansea) with some others showing a rise in price. Most of northern England has seen declines in price or in some clusters such as around Manchester or York seeing slight rises.
The consequences of these high prices on the working people of Britain have been harsh. The Telegraph reports today that a person in their mid-twenties in the UK can expect to pay £66,800 in rent by the time they are thirty.
On Sunday night Channel 4 aired a documentary on the current bubble showing miserable properties with asking prices ten times greater than the median wage. The Guardian reports today that the “young” are moving out of London in droves.
Clearly, the average British worker is being squeezed just to put a roof over his head.
Today the Telegraph reports that, "Borrowing on credit cards and demand for personal loans increased by 6.4pc in October compared with a year earlier, according to the Bank of England, representing the fastest annual increase since July 2006."
Sky news report that, “households with a single breadwinner spent more than they earned last year.”
The British taxpayer is mired in debt and struggling to make ends meet. So neither the British public nor foreign investors look likely to buoy the vastly overvalued London property market in the coming months.
It is worth remembering that many of the reasons cited for London’s extraordinary house price growth were also cited in Dublin prior to the crash.
A housing correction or crash will likely lead to more negative equity among London property buyers and the many British mortgage-holders who are struggling. The nascent recovery in the national UK property market would be snuffed out.
This may lead to defaults and further stress on the fragile banking system. It also has ramifications for sterling and UK gilts, both of which are likely to come under pressure.
MARKET UPDATE
Today’s AM fix was USD 1,203.25, EUR 975.24 and GBP 768.95 per ounce.
Yesterday’s AM fix was USD 1,197.00, EUR 962.68 and GBP 761.60 per ounce.
Gold fell $14.30 or 1.18% to $1,198.30 per ounce yesterday. Silver slipped $0.02 or 0.12% to $16.45 per ounce.
The gold price hovered above $1,200 per ounce in early morning London trading, with no clear immediate catalyst to move prices up or down for now.
Silver at $16.40 is trading within a tight 36 cent intraday range. In the PGMs, which have been strengthened following good U.S. car sales yesterday, platinum was $7 up at $1,219/1,225, while palladium was also up $7 at $806/811.
Spot gold was last seen up 0.2% or $3.10 at $1,200.50/1,201.30 per ounce after reaching a high of $1,208.50, despite the dollar being firm. Some gold buyers see the recent price action as indicative of a possible bottom and are dollar cost averaging into position in anticipation of gains in 2015.
Due to fears that Russia will fall into a recession this year, currency wars and the strength of the US dollar, the Russian Central Bank was forced to intervene to stem the decline of the plummeting ruble. The ruble hit record lows at 54.87 to the dollar and the Russian Central bank was forced to sell off $700 million of foreign currency reserves earlier this week.
The plummeting ruble is likely to lead to an even greater increase in the Bank of Russia’s demand for gold and exacerbate the already tight physical gold market.
Investors will look for guidance from the U.S. non-farm payrolls number for November which comes out on Friday. A weaker than expected number after disappointing retail sales this week would lead to a safe haven bid. A better than expected number, would likely see traders sell positions or go short.
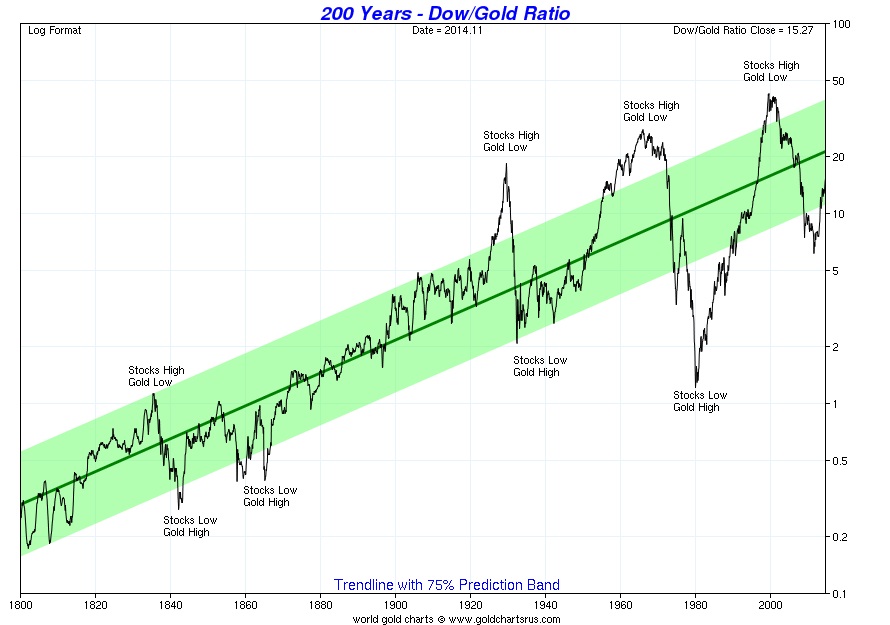
With stocks continuing to reach new record highs and the Dow Jones Industrial Average at 17,800, gold, after its 40% fall, looks better value versus stocks today. The Dow Gold ratio is now at 15 (Dow at 17,800 and gold at $1,200/oz - see chart above) which is quite high from a historical perspective. We expect a reversion to the mean in the coming years and the ratio to fall below 5 as gold outperforms U.S. stocks.
********
Courtesy of http://www.goldcore.com/
 Mark O'Byrne is executive and research director of www.GoldCore.com which he founded in 2003. GoldCore have become one of the leading gold brokers in the world and have over 4,000 clients in over 40 countries and with over $200 million in assets under management and storage.We offer mass affluent, HNW, UHNW and institutional investors including family offices, gold, silver, platinum and palladium bullion in London, Zurich, Singapore, Hong Kong, Dubai and Perth.
More from Silver Phoenix 500


