Market AGAIN More Precariously Euphoric Than Any Time In History


We are now seeing the most euphoric stock stock market in history — a market as precariously perched as the one I laid out last January. “Market Euphoria Surpasses Dot Com Levels” says one headline.
There is another way of putting it: extreme euphoria.
The sudden hope of multiple vaccines appears to have inoculated the market against an epidemic of bad news that would normally drive markets down.
First, the most stridently contested (and possibly corrupt) election any of us has ever witnessed is the kind of uncertainty markets usually run from. The presumptive victory of the candidate who most promises to raise taxes is also something markets usually don’t like. The rapid resurgence of COVID back to its spring crisis levels is something the market certainly hated when COVID first hit this year and ripped the economy to shreds. The return to full COVID lockdowns in many areas is something the market should fear, having experienced the economic damage wrought by spring’s brief lockdowns and knowing now how long-term that damage can be. These lockdowns could last even longer since we are in the coronavirus’s typical favorite time of year in a season when weeks of indoor holiday festivities could turn out to be “super spreader” events. We shall see.
Meanwhile the approaching end-of-year termination of the numerous economic protective programs that have been put in place and the impending December budget war following with the greatest October deficit in history all seem to be offset by the glinting hope of a $900 billion stimulus program, far smaller than the stimulus programs that failed to pass congress earlier this year. Never mind, however, that all such promises in the past several months have failed.
How upside-down, fat-end-up crazy is it?
Reality has completely departed from Wall Street. While the market dropped in September and October as I thought it would, it only fell to the edge of correction levels (down about 10%) each month and then righted itself both times. Certainly no October surprise.
The real surprise has been in seeing the market take off and soar in its greatest November of all time right after Trump ostensibly lost the election. We remember how it soared when he won in 2016. Well, now it soared even more when by all counts and courts so far, he has lost in 2020.
Much of the post-election rally actually came from people covering their shorts, which they put in during the more tumultuous months of September and October:
The most shorted stocks were up 28.48% since November 2, while the S&P 500 is up about 11.1%. The Goldman Sachs Most Shorted Index’s RSI reading is 84.14, only eclipsed by June 20, 2018.
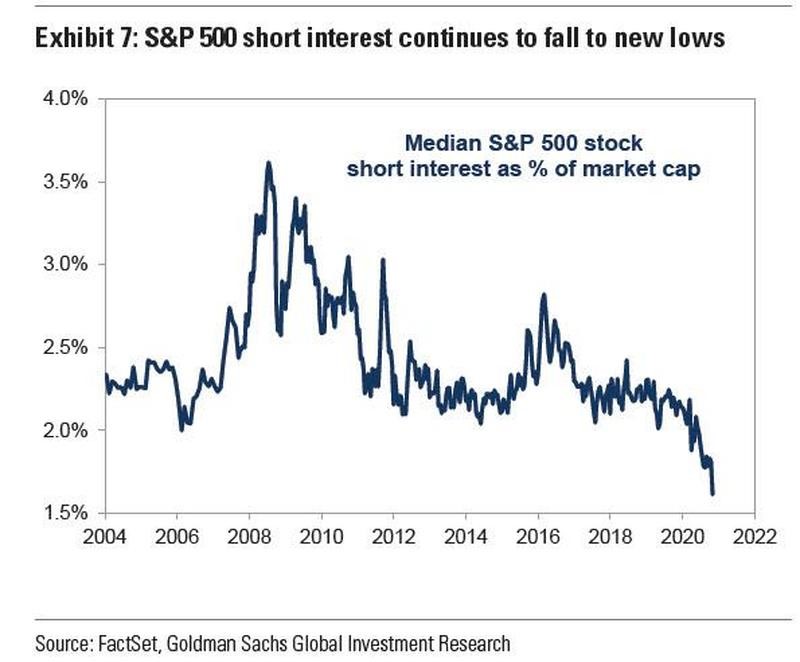
Now that we’ve gone full euphoria, however, with almost everyone running long in what I think is “hope against all hope,” market shorts have drained to their lowest point in recent history:
Put another way, the market is up here, while the put-call ratio is down there:
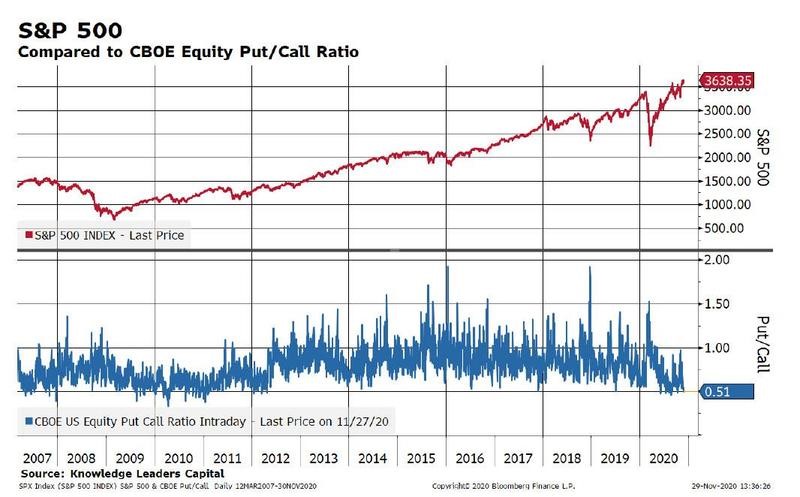
Zero Hedge
That’s one way of saying, “We’re all in.” How in? Well 93% of all stocks on the S&P are trading above their 200-day moving average, and optimism is at an apparent all-time high. The market has gone very, VERY long!
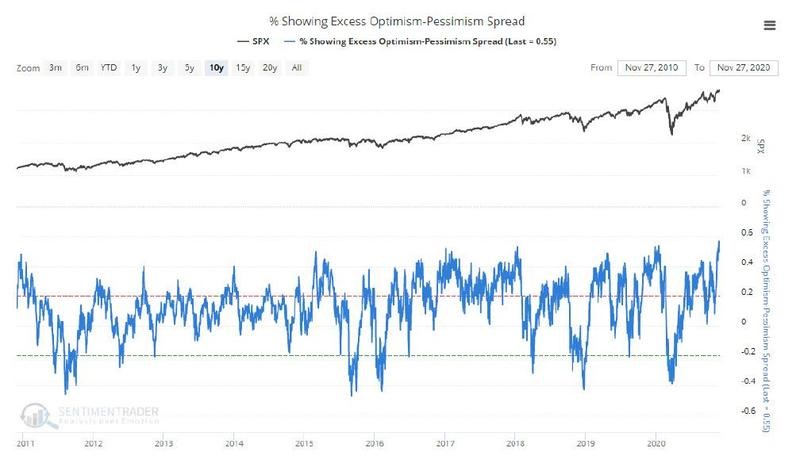
Zero Hedge
… with speculation being nearly at its peak extremity:
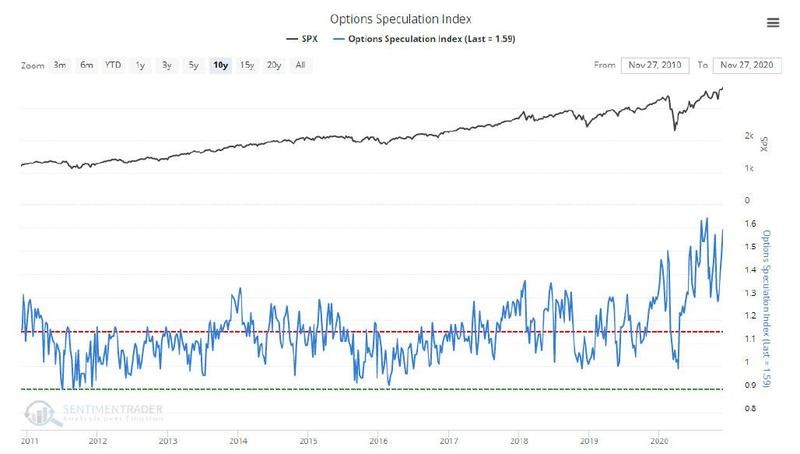
Zero Hedge
The S&P forward P/E ratio, often used to measure whether stocks are over- or under-valued is back for the first time to peak dot-com bust levels:
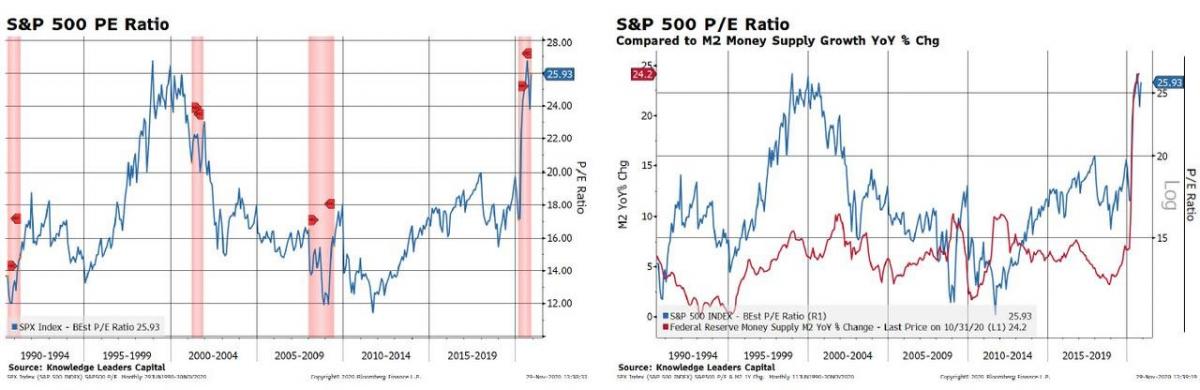
Zero Hedge
But, as Zero Hedge points out, consumer confidence certainly doesn’t match up:
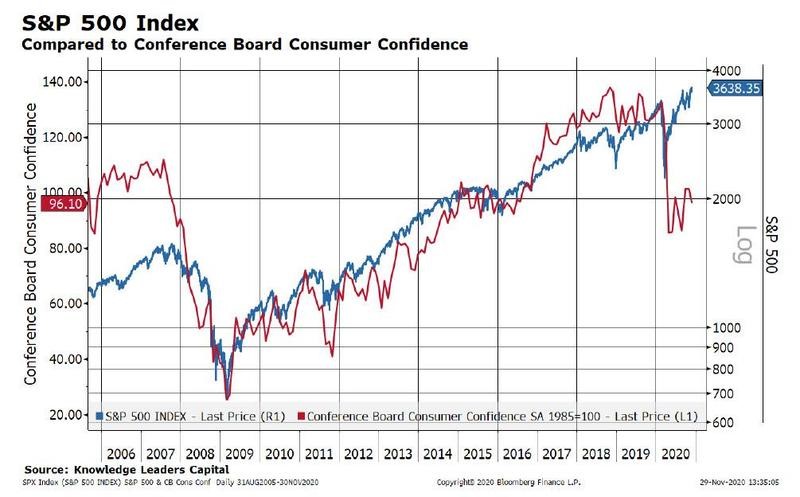
Zero Hedge
… and the so-called smart money doesn’t match up:
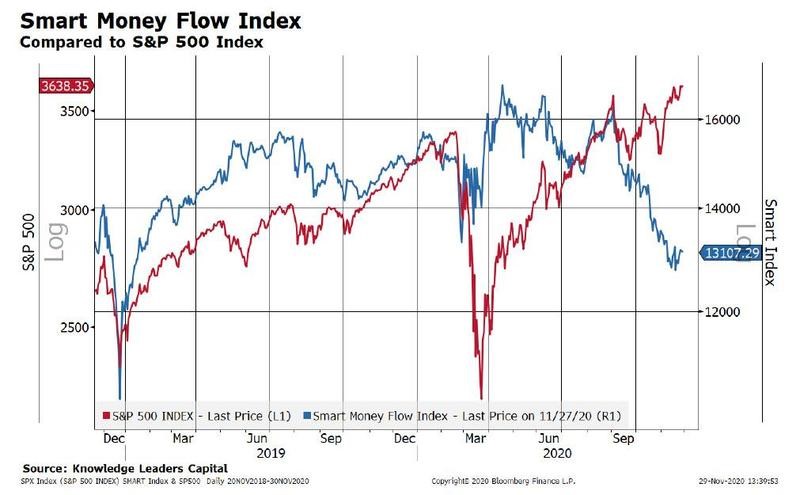
Zero Hedge
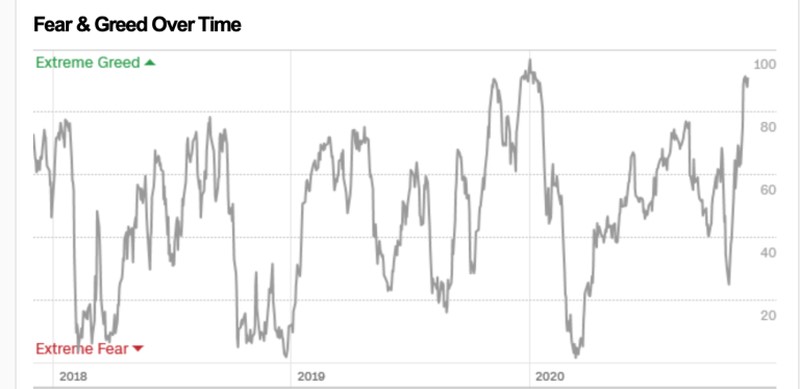
As a result, the famous Fear & Greed Index looks like this:
I’m not selling until it hits 105. pic.twitter.com/c3QTlBZCmw
— Sven Henrich (@NorthmanTrader) November 25, 2020
Virtually no fear anywhere in sight, which is just about where we were when I wrote that similar article to this one last January, titled “Stock Market More Overpriced and Perilous Than Anytime in History.” It took about a month before the big crash came.
We can see where fear went from there:
Greed, as additionally measured in positioning and sentiment, is reaching a uniformity of positioning and consensus either at rarely or at never before seen levels. Everything is vertical and one way.
And we know what that means. When everyone is one one side of the trade, it often proves life-saving to be on the other before long. One has to wonder when balanced funds that maintain a defined value ratio of stocks to bonds are forced to rebalance at the upcoming end of the year after such a rise in stocks, what happens?
It might be fairly stated a lot of what we are currently seeing is entirely incompatible with history. The hype is tremendous as literally everybody is long, hyping for ever higher prices, protection doesn’t exist and charts are tremendously extended.
According to the “Buffett Indicator,” the market is overvalued whenever the totality of market cap is more than 100% of GDP. Look where we are now:
179.9% market cap vs. GDP.
The widest market disconnect from the economy ever.#documentingreality pic.twitter.com/YLCpEEYD6U
— Sven Henrich (@NorthmanTrader) November 28, 2020
Never been higher.
I do actually mean NEVER:
Ever is a long time. pic.twitter.com/3YQ3SOuxlF
— Sven Henrich (@NorthmanTrader) November 28, 2020
This means valuations have NO economic foundation.
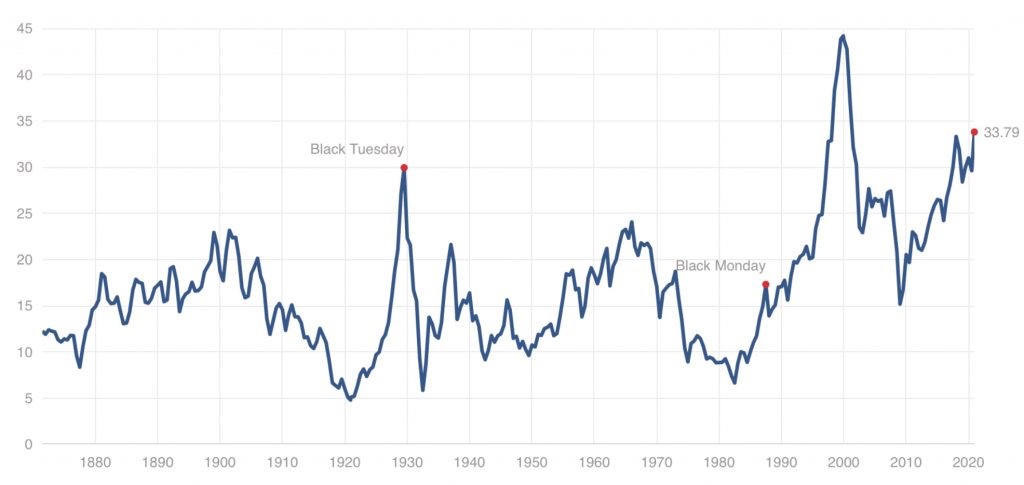
By yet another measure, the Shiller CAPE Ratio, stocks are more overvalued than they were at the 1929 crash. They are, in fact, the highest they’ve been in history, except at the dot-com bust — even higher than they were when I wrote that January article:
These heady levels on all measures, of course, have been attained because of the combination of US government and Federal Reserve working in consort now to create the world’s craziest money balloon.
With that, lets check up on the most important underlying fact about the economy, about which the market does not care.
Frigid employment goes sub-zero
Employment after the spring crash already stopped far short of full recovery, as I reported in a recent article. Today, the New Jobs number for November came in at 245,000, far, far below October’s 610,000, and far below the estimates by economists, which had pegged about 440,000.
Unsurprisingly as we move from brick-and-mortar retail to online retail, retail jobs dropped, even as we moved toward the normally high retail season, while warehousing jobs rose.
Putting the job number in perspective,
You can see, all the new jobs added since the 2020 stock-market crash (including those that merely get reposted as new jobs because the descriptions get rewritten and those that go unfilled) fall far short of replacing the jobs lost in this spring’s catastrophic collapse, and the rate at which they are being added now is back to our longterm pre-pandemic hiring, meaning the post-pandemic rehiring surge has expired, as I said it would, far below normal employment. At this rate, it will take until 2024 to bet back to where we were before the lockdown/shutdown economic catastrophe.
In terms of total unemployment, we are holding about flat now, but it is a VERY high plateau. We’ve improved about 60% in terms of normal unemployment role, but less than that in the kinds of unemployment that we usually don’t even track — self-employment or contract workers who have no work.
It ain’t over till the fat lady falls … and she’s got even further to fall this time than she had last January.
*********

David Haggith started writing about the economy after he predicted The Great Recession half a year before it hit and was puzzled as to why no economists or stocks analysts saw it coming. In the months after the crisis broke out, he started to write humorous editorials in a series titled “Downtime,“ which chided the U.S. government and bankers who should have seen the economic collapse coming but whose cronyism, greed and ineptitude caused them to run the world into a ditch. Those articles were published in The Hudson Valley Business Journal, The Valley City Times-Record (North Dakota), and The Daily Herald in Tennessee. Haggith is dedicated to regularly criticizing the daily news — not just the content but the uncritical, unthinking nature of almost all of the reporting. He now writes his own blog, The Great Recession Blog, to break down the news as an equal-opportunity critic toward both Republicans and Democrats / Conservatives and Liberals … since neither kind of politician has done anything worthwhile to plot a better economic course. His articles are regularly carried by several economic websites.
More from Silver Phoenix 500


