Market Turning Points


“By the Law of Periodical Repetition, everything which has happened once must happen again, and again, and again -- and not capriciously, but at regular periods, and each thing in its own period, not another’s, and each obeying its own law … The same Nature which delights in periodical repetition in the sky is the Nature which orders the affairs of the earth. Let us not underrate the value of that hint." -- Mark Twain
Current position of the market
SPX: Very Long-term trend – The very-long-term cycles are in their down phases, and if they make their lows when expected (after this bull market is over), there will be another steep decline into late 2014. However, the Fed policy of keeping interest rates low has severely curtailed the full downward pressure potential of the 40-yr and 120-yr cycles.
Intermediate trend – Failed to overcome resistance at the high.
Analysis of the short-term trend is done on a daily basis with the help of hourly charts. It is an important adjunct to the analysis of daily and weekly charts which discusses the course of longer market trends.
THE CORRECTION CONTINUES!
Market Overview
For the past five weeks SPX has traded roughly between 1840 and 1883, with the DJIA making a somewhat similar pattern. Russell 2000 and NDX, however, have experienced more concentrated selling. With a cycle low not due for another few days, it is likely that the correction will continue -- and perhaps intensify -- throughout most of next week. When it has come to an end, it should be followed by a rally, the nature and duration of which should give us a good sense of what the market has in store for us.
There is a good possibility that the rally could turn out to be very short. Mid-April will be a critical period to watch for a potential resumption and extension of the correction which would then have a good chance of becoming one of intermediate dimension and last until July. If this is the case, we could be witnessing not a simple correction, but the making of a top which could remain unchallenged for the rest of the year. The long-term cycles which are scheduled to bottom in October would probably have made their presence felt long ago if it had not been for the Fed’s intervention. They could take hold at any time and, once they do, they won’t let go until they have made their lows.
Let’s do a little forward thinking! If things pan out this way, a major correction of the SPX’s bull market advance to-date could retrace down to about 1400 (.382) and, in a worst case scenario, to 1275 (.50) of the current 1200-point advance. This is not merely fanciful thinking but a technical evaluation of what may lie ahead and something for which we should be prepared psychologically. It goes without saying that the necessary adjustments will be made as we move forward.
Chart Analysis
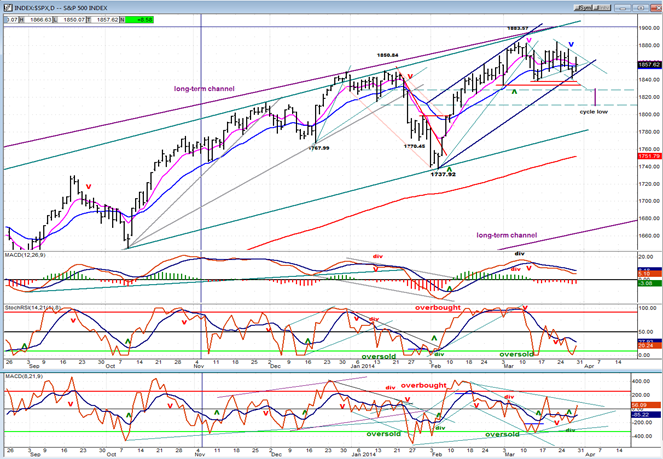
I won’t show the weekly chart but, after developing some negative divergence, its oscillators have turned down and are still in a declining mode, suggesting that the correction is not over. The overall pattern also has the look of a potential top (even more so on the 3X P&F chart).
The daily chart (courtesy of QCharts.com) is a little less bearish in the sense that it is already showing preliminary signs of seeking a bottom. The sideways move in price has now gone from one side of the channel to the other with the bottom channel line containing Thursday’s downward spike.
Since the cycle low is still a few days away, it’s possible -- and even probable -- that the 1840 level which has held, so far, will be breached before the correction is over. I have drawn some green dashed lines which represent the .382 and .50 retracement of the move from 1738. Those are the approximate levels at which the correction is likely to come to an end.
The oscillators are showing signs of bottoming, especially the lower one (A/D) which is already trying to reverse and showed some positive divergence at Thursday’s low. The MACD lines have not crossed yet, but the index has remained positive throughout the pull-back. Normally, this is a sign that the weakness will be limited. Of course, with the low expected to still be a few days away, all this could change.
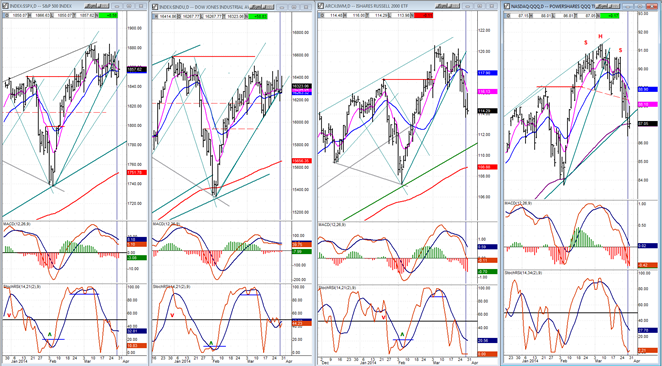
 In the following charts, (also courtesy of QCharts.com) you can see that the IWM and QQQ took the brunt of the selling. They had outpaced the other indices on the upside and are experiencing the most profit-taking on the downside. By comparison, the SPX and DOW show much more moderate weakness. The DOW which had been the weakest index, refusing to surpass its Dec./Jan. high while the others surged above to new highs, has now become the strongest index in this correction. I am not sure that this has any significance. My attention is more focused on the QQQ which has made a H&S top and is in the process of challenging a very important trend line. I have always felt that the QQQ (NDX) was one of the best leading indicators and on the P&F chart, it has made a distribution pattern which could take it two or three points lower before ending its correction. If it cannot rally strongly afterwards, it could spell trouble for the rest of the market.
I suppose that we should also take a look at the hourly SPX chart. It will give us a lot of valuable technical information.
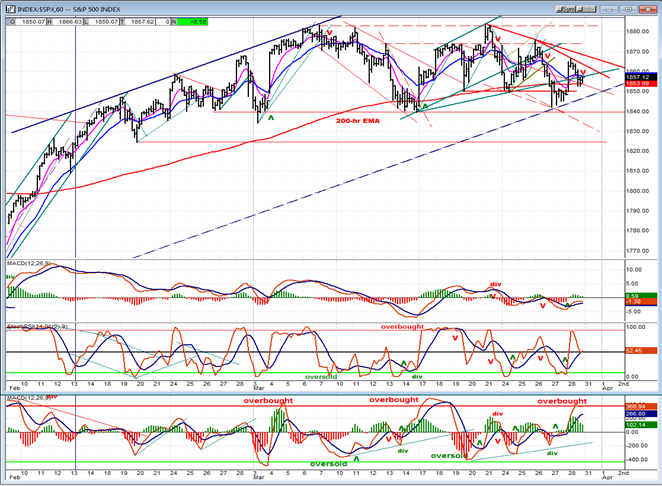
As mentioned earlier, the index traded in about a 40-point range between 1840 and 1883 for several weeks. At the end of the last week, it made a double top and then started to decline. This time, however it did not stop at 1850 but dropped to the very bottom of the range. On the subsequent rally, it not only failed to reach the top of its declining channel but was repulsed immediately. Normally, the inability to reach the top of a channel is a sign that the trend of the decline is about to accelerate. I have drawn a new potential downtrend channel to show what might be expected of the price pattern over the next few days.
Since the low of the cycle is still a week away, it would make sense for both the (dashed) bottom channel line from 1738 and the 1840 level to be finally penetrated on the next down move. With a lower support line at 1825, a pivot point at 1828, a P&F projection to 1825, and the .382 retracement of the entire uptrend from 1738 at 1828, there is a very good chance that this is the area where the extension of the decline should take us.
Now let’s look at the oscillators. Starting from the top, in Friday’s rally, the MACD barely moved up before it flattened out. Next, the SRSI quickly became overbought, and just as quickly retraced half of its entire range. As for the A/D MACD (at the bottom), it became overbought and was still overbought at the end of the day. A retracement would be normal, requiring weakness in the A/D, which would most likely cause a decline in price.
One final, but important, observation! Notice that since the middle of the month what has supported prices has been not so much the 1840 level but the 200-hr MA. After holding the SPX for three consecutive pull-backs, it was severely breached on Thursday. The index did manage to rally and barely close above it one more time on Friday. It is clear that the 200-hr MA has been the real line of support for SPX and the next time it is penetrated it will signal the beginning of the final decline into the cycle low.
Cycles
Next Friday is the ideal time frame for the cycle low.
Breadth
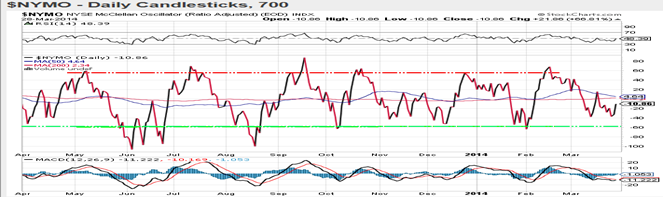
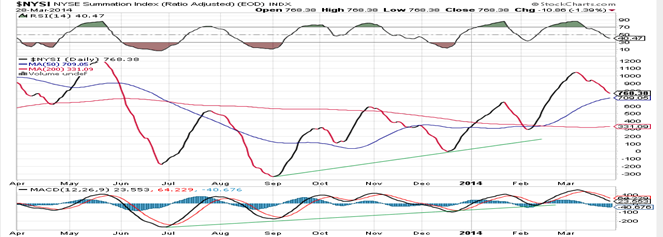
Above, we have the McClellan Oscillators and the Summation Index (courtesy of StockCharts.com).
During the entire correction, the McClellan Oscillator has remained negative and this has caused the Summation Index to continue its decline. Since its RSI (which is also declining) has not yet reached oversold, we can assume that the correction is probably not over. Most likely, the Oscillator will continue to decline at least until it reaches the green line below. This line identifies the bottom of a normal corrective move.
Sentiment Indicators
The SentimenTrader (courtesy of same) long-term and short-term indicators have now remained at the same values for six consecutive Fridays.
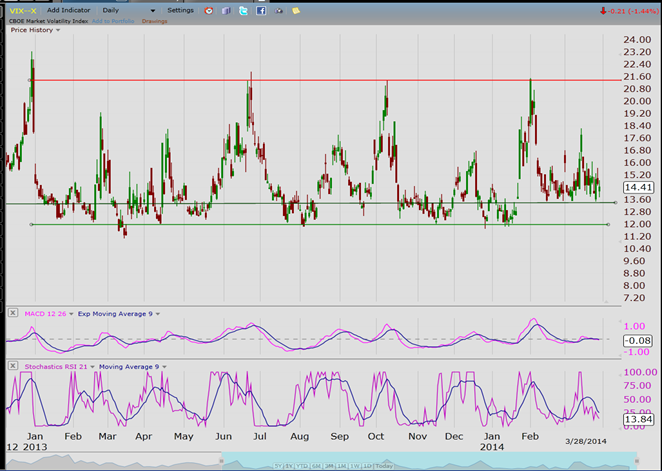
VIX (Velocity Index)
VIX is also stuck in a range from which it is not anxious to extricate itself. Traders’ lack of interest may suggest that they do not see imminent protracted weakness in the market. This is curious since they held it at a higher level while the market was making a new high. We need to give it more time to clarify what this all means.
XLF (Financial ETF)
I showed QQQ above, so I am going back to XLF this week.
XLF spurted to a new high along with the banks when the latter scored well on their stress test. It has still pulled back and is more in tune with the SPX. Additional market weakness should pull it down a little lower.
TLT (Barclays 20+ year Treasury bond fund)
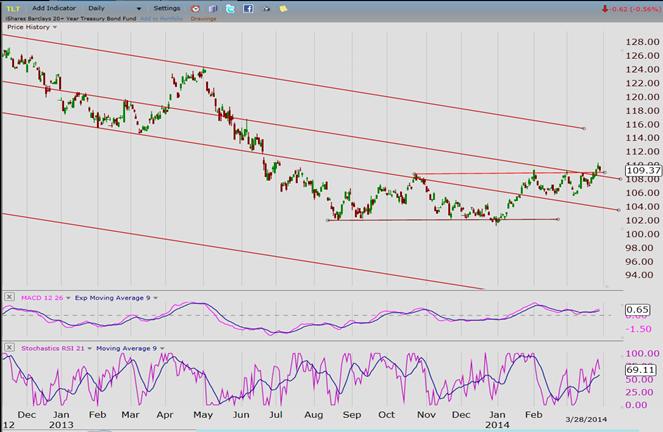
TLT is attempting to break out of its consolidation range. It has not cleared it by enough of a margin yet, and is risking falling back when the market stabilizes. The pattern being made by the MACD indicates that this is a weak move. If it wants to stay above, it will have to show that it is capable of accelerated upside momentum.
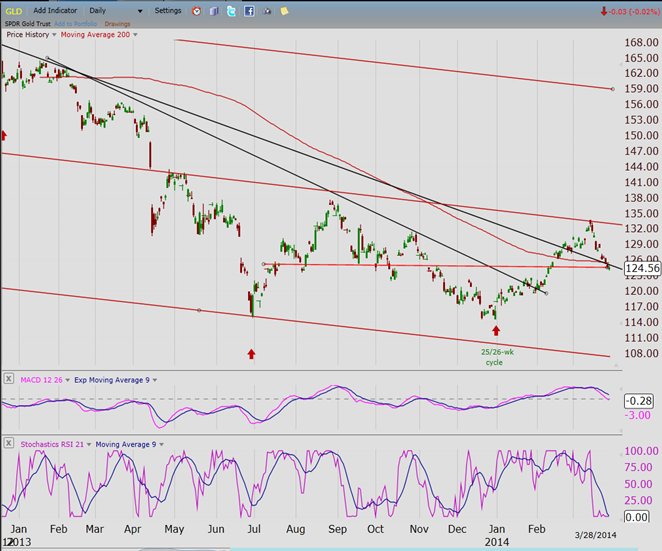
GLD (ETF for gold)
GLD found resistance at the mid-point of its long-term consolidation channel and retraced 50% of its short-term uptrend, which has driven it slightly below its 200-DMA. Time–wise, it is roughly halfway through its 25-week cycle. It will have to show that there exists other factors which can assist it in regaining its upside momentum. If not, it may be doomed, at best, to a sideways pattern until the next cycle low.
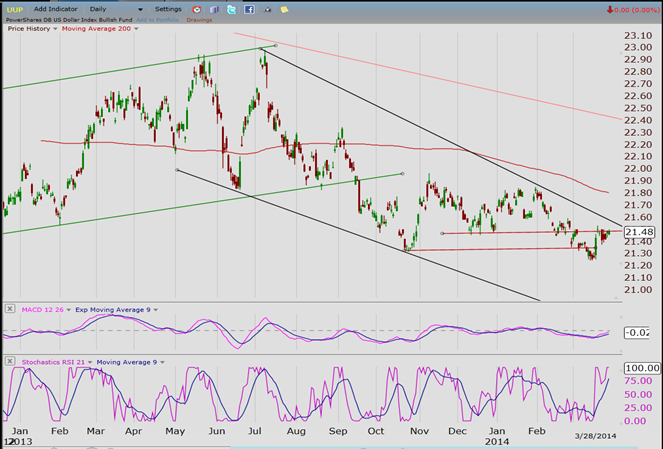
UUP (dollar ETF)
UUP rallied sharply for a couple of days and has done nothing since. I mentioned before that it appeared to be affected in reverse by GLD’s 25-week cycle. If the cycle has turned down, then UUP should benefit from this by continuing its uptrend. Otherwise it will most likely resume its downward drift which could take it to new lows.
The two indices do not always move exactly in opposite directions with the same velocity, so it is best to analyze them separately instead of trying to make them strictly interdependent.
USO (United States Oil Fund)
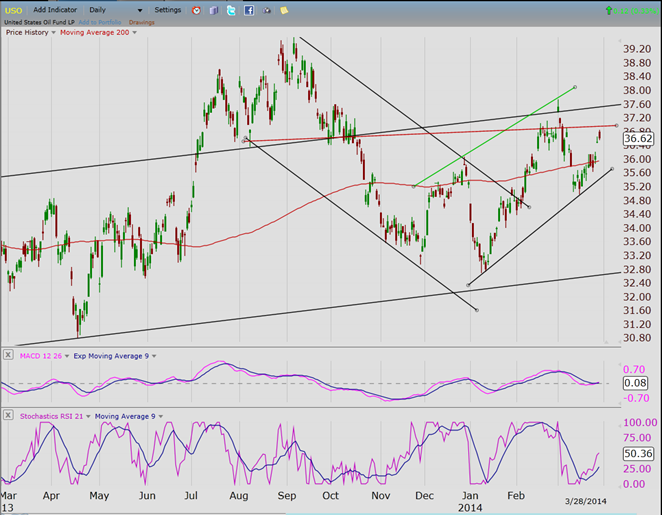
USO found support where it should have and has had a good bounce. It is too soon to tell if it is attempting to resume its uptrend or if it is simply re-testing its recent high. The lack of upside momentum in the MACD during this bounce is not encouraging, especially since USO has, once again, reached the lower level of the resistance area which stopped its last advance. It, too, needs to clarify its intentions.
Summary
SPX has been moving for several weeks in a sideways pattern, establishing 1840 as its lower range. With signs of additional weakness beginning to appear, plus a cycle pulling it down into a low which is still ideally several days away, that price level stands a good chance of being breached, perhaps as early as Monday.
There are several factors which point to a final correction target in the 1825/1828 range that should be reached by the end of next week. The subsequent rally will determine what more to expect of the stock market going forward.
********
FREE TRIAL SUBSCRIPTON
Market Turning Points is an uncommonly dependable, reasonably priced service providing intra-day market updates, a daily Market Summary, and detailed weekend reports. It is ideally suited to traders, but it can also be valuable to investors since highly accurate longer-term price projections are provided using Point & Figure analysis. Best-time reversal estimates are obtained from cycle analysis.
For a FREE 4-week trial, send an email to: info@marketurningpoints.com
For further subscription options, payment plans, weekly newsletters, and for general information, I encourage you to visit my website at www.marketurningpoints.com. By clicking on “Free Newsletter” you can get a preview of the latest newsletter which is normally posted on Sunday afternoon (unless it happens to be a 3-day weekend in which case it could be posted on Monday).
The above comments and those made in the daily updates and the Market Summary about the financial markets are based purely on what I consider to be sound technical analysis principles. They represent my own opinion and are not meant to be construed as trading or investment advice, but are offered as an analytical point of view which might be of interest to those who follow stock market cycles and technical analysis.

When Andre Gratian was a stock broker years ago, a friend introduced him to technical analysis of the market. Consequently, it is not an exaggeration to say that Andre fell in love with this approach! Ever since then, it has become an increasingly important part of his professional life. Gratian has studied the works of Wyckoff, Edwards & Magee, Edward J. Dewey (cycles) and many others. However, one of my most profitable undertaking has probably been to study Point & Figure charting, which he finds invaluable in analyzing stocks and indices. If he were restricted to one methodology, this is the one that he would choose. This well-rounded background has given him what he feels to be a special insight into the stock market, facilitating the recognition of meaningful patterns and the ‘turning points’ in all trends, whether they be short or long term. Andre feels very comfortable discussing the stock market and passing on meaningful information to others. His subscribers include individuals and money managers throughout the world. Moreover, his Newsletters are currently published on several financial sites, here and abroad.
More from Silver Phoenix 500


