Market Turning Points


Current position of the market
SPX: Very Long-term trend – The very-long-term cycles are in their down phases, and if they make their lows when expected (after this bull market is over), there will be another steep decline into late 2014. However, the Fed policy of keeping interest rates low has severely curtailed the full downward pressure potential of the 40-yr and 120-yr cycles.
Intermediate trend – Failed to overcome resistance at the high. Starting intermediate decline.
Analysis of the short-term trend is done on a daily basis with the help of hourly charts. It is an important adjunct to the analysis of daily and weekly charts which discusses the course of longer market trends.
NEARING RALLY IN DOWNTREND?
Market Overview
This time, it looks as if the market has caught a severe cold which might, overtime, even turn to pneumonia. We should soon be able to make a better diagnosis since there are signs that we may be getting close to a minor reversal of the downtrend. An early signal has been given by the P/C ratio which shot up to its highest level in over a year on Friday. Most of the time, this action is followed by a secondary top while the market makes a new low before it finds support; but it could be one or two days before it does. So although there were signs of deceleration on Friday, the actual low may not arrive for a little while longer.
The deceleration pattern can best be seen in the 15m chart of the SPX and even more so in the XLF (which appears to have had a selling climax at Friday’s opening and remaining above its opening price for the rest of the day while other indices went on to make new lows by the close). Minor signs of positive divergence are also appearing in the SPX 15m MACD (similar to those which formed on 4/8 before our first downtrend rally), and in the A/Ds. If we do not get news which the market construes to be negative over the weekend, there is a chance that we could reverse as early as Monday, although next week does not appear to have the best background atmosphere for a rally to take place.
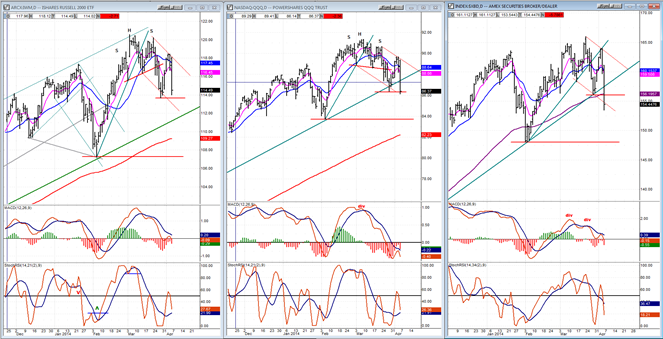
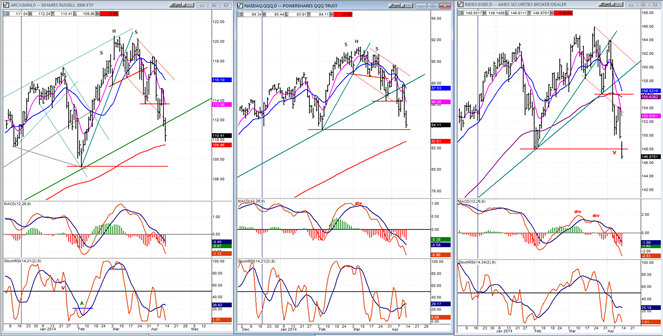
Throughout the decline, our favorite leading indices (QQQ, XBD, XLF and IWM) were definitely in charge while SPX and DJIA tagged along. Even more important, XBD is the first index to breach its February support, with NDX close behind it. This is beginning to give the market a different tone. As long as all we did was to break the March low, it could be construed that a short-term correction was taking place. Breaking the February low starts to have intermediate trend implications!
Chart Analysis
Last week I showed you the charts of the principal leaders and how they compared to the SPX. I am going to show you the same charts (courtesy of QCharts.com), but one week later. The deterioration which took place over the past week is obvious, as is the fact that the last one (XBD) is now leading on the downside. Accordingly, XBD should be the first index to show us when the decline is over—which is not yet! On all three charts, MACD is weaker than the price. When the reverse takes place and positive divergence appears, we can begin to look for a meaningful reversal in the downtrend (don’t hold your breath just yet!).
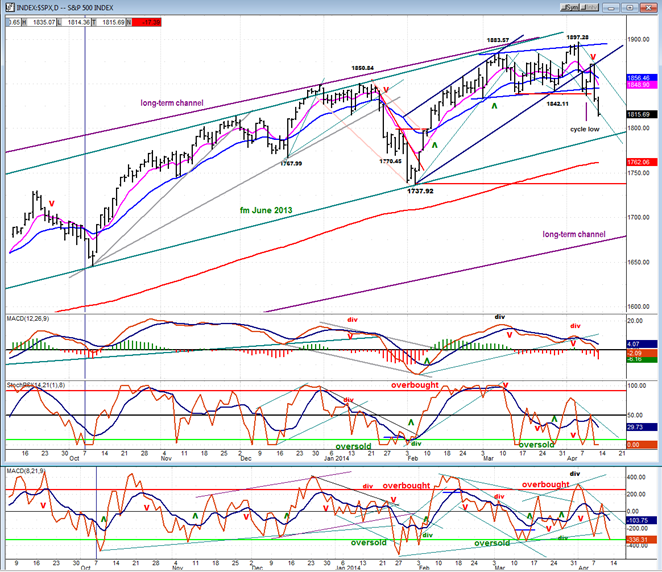
 Let’s now look at the SPX daily chart (also courtesy of QChart.com) to see how it compares with the leaders, above. The difference is significant, especially when compared with the XBD which has already fallen below its early February low.
The SPX has started a decline which looks very much like the one that began in January. It varies from that one in the fact that it started from a much more important level of distribution, especially when the two are compared on a 3X P&F chart. The most recent one has a top formation with a potential count to 1617 and perhaps even a little lower. That represents a significant decline if it occurs. But then, in a newsletter written at the beginning of the year, Clif Droke discusses Kress cycles and the possibility of a period of market weakness starting in early May and lasting into July. If he is right, we are at the very beginning of a protracted intermediate decline.
Certainly, the various daily indicators are all in a sell mode -- as are the weekly. However, with most intermediate and long-term trend lines still intact, and with the price of SPX and other indices still above their 200-DMA (although XBD is close to reaching it) not enough damage has yet been done to suggest that the bull market has ended. But if Droke is correct and the decline which just started has a brief rally into early May and then continues into July, I may have to reconsider that statement.
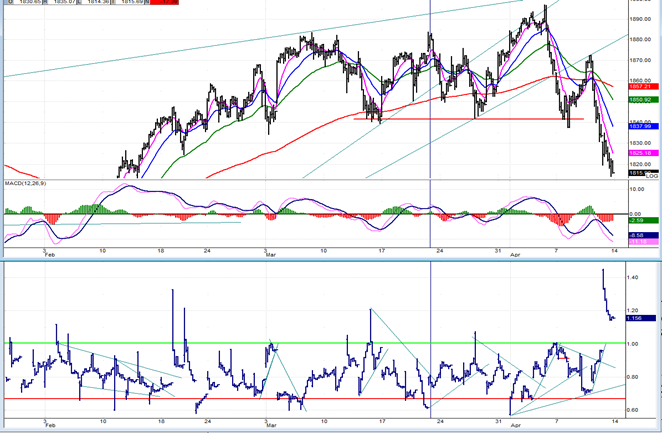
We’ll now study the hourly chart to see if we find traces of a potential imminent reversal (suggested by the P/C ratio action on Friday).
Although the positive divergence is only advanced in the histograms, it would only take a little more bottom formation to spread it to the other oscillators. They are all oversold and could easily turn in 2 or 3 days. The index itself has found support at the bottom of a well formed channel which it was in the process of testing and re-testing on Friday. However, it could easily overshoot it in a climactic move before reversing. The increased disturbance in Ukraine over the weekend could rattle the market at Monday’s opening and entice bargain hunters to buy in a climactic sell-off, which would lead to a quick turnaround.
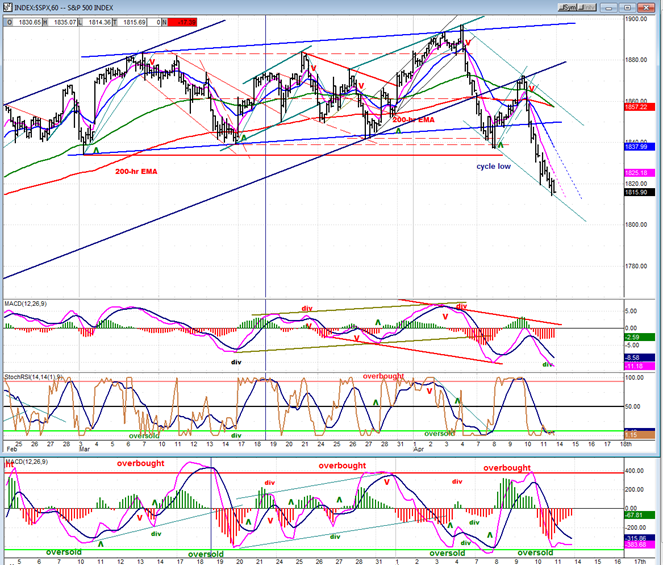
When we do reverse, the rally in a downtrend could turn out like the last one and rise to the top of the declining channel as the oscillators move from an oversold to an overbought position. But it would probably require more intricate action to fulfill Clif Droke’s prediction of a top at the beginning of May. Incidentally, that timing for the next top is also shared by Erik Hadik -- another cycle specialist -- and could add a little credibility to this forecast.
Cycles
The anticipated cycle low came in the predicted time slot and created a rally, but the developing primary trend quickly overwhelmed it and caused it to fail early in its up-phase.
The next cycle highs are expected in very early May.
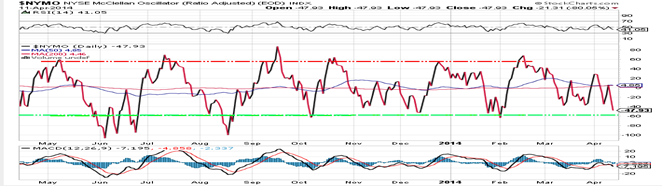
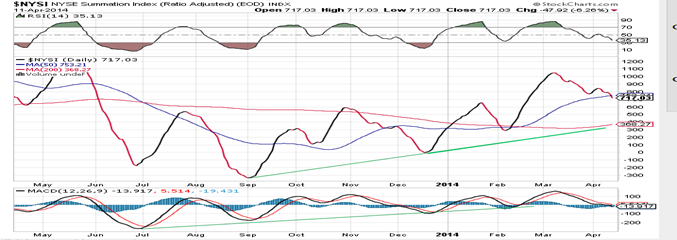
Breadth
Below, we have the McClellan Oscillators and the Summation Index (courtesy of StockCharts.com).
The McClellan oscillator has fallen off its ledge and is heading lower. It is not yet terribly oversold but it has been correcting for nearly two months and that could prevent it from going much deeper. By remaining negative, it has also allowed NYSI to continue its correction; but its decline remains fairly shallow and its RSI has not reached the extreme oversold correction level that it sometimes does. Does that mean that the price correction still has further to go before it can achieve even a short-term reversal? Or is it a sign of underlying breadth strength in spite of the steep sell-off? We’ll know next week!
Sentiment Indicators
With the selling, the SentimenTrader (courtesy of same) long-term and short-term indicators have
dropped to a more neutral value. The current reading does not have much predictive value for future market action.
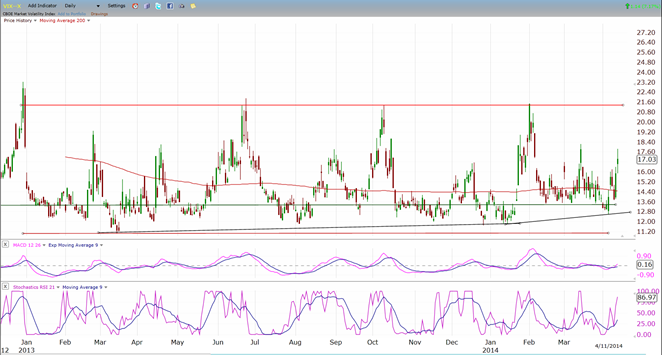
VIX (Velocity Index)
VIX seems very slow to react to the market correction. This is a departure from the last three declines when it was more responsive. I am not sure what this means. It’s as if it did not trust that the decline is for real and that an end to it will come at any moment.
What I do know is that it is starting this move from a much larger base and that this should enable it to easily surpass the other peaks. Since its action may be some sort of yellow flag instead of an aberration, we’ll watch closely what it leads to.
P/C
This index normally spikes a few hours before a low is made. A very large spike occurred on Friday. Does this mean that a low will be formed on Monday or Tuesday? It’s a warning, so we should heed it and see if, once again, it predicts a short-term reversal in the market.
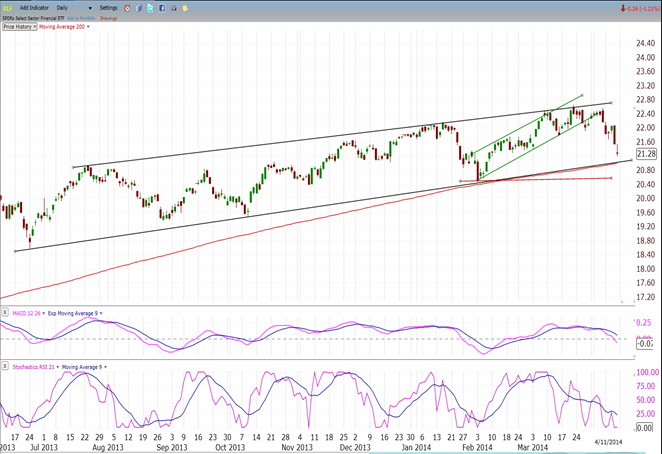
XLF (Financial ETF)
XLF has continued its sharp decline but is quickly approaching an intermediate trend line which corresponds exactly with its 200-DMA. Surely, this should provide some support, at least temporarily. Also, on intraday charts, Friday’s action looks climactic and could lead to a minor reversal.
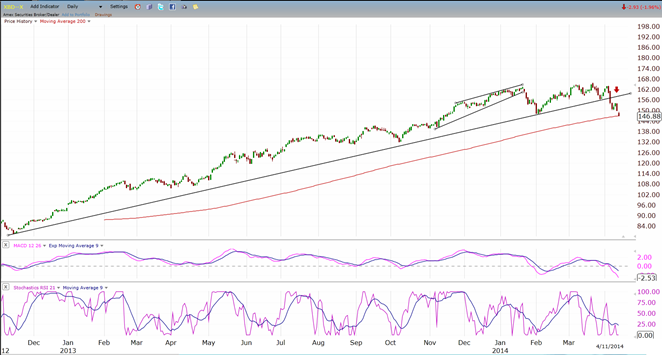
XBD (Amex Securities Broker/Dealer)
XBD is generally regarded as one of the best leading indicators for intermediate and long-term reversals. In the current decline, it has outpaced all the other indices, already challenging its 200-DMA after breaking an intermediate trend line. It, too, could find temporary support here.
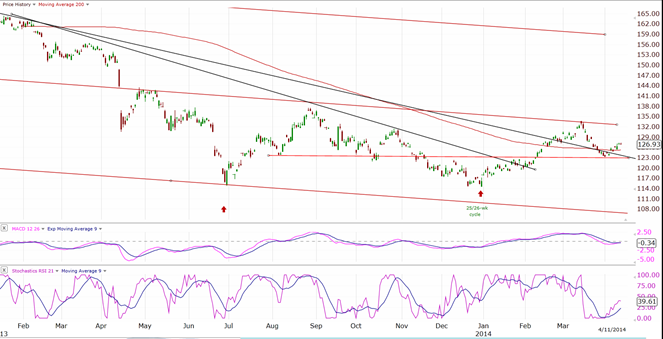
GLD (ETF for gold)
With the renewed weakness in the dollar, GLD has managed to bounce off the level which provided support. This move does not yet have the looks of an uptrend resumption. That allows for several options. Let’s see which one is identified by next week’s price action. (GLD should have been expected to have a stronger rally in response to the market’s weakness.)
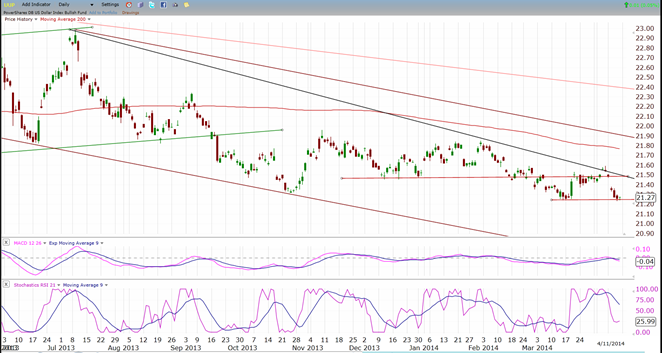
UUP (dollar ETF)
UUP could not overcome its intermediate downtrend line and was pushed back. If it does not hold here, it stands the possibility of challenging its 2011 lows of 20.84 which is now less than .50 away. Its weakness is helping GLD, but perhaps not as much as it should.
Summary
The market decline continued last week, bringing the SPX to the lower line of a channel which was created by a parallel to its declining short-term tops. It was tested twice and held, on Friday. If it holds at Monday’s opening, it will most likely signal the beginning of a second rally in the downtrend which started at 1897. There are certain conditions which support this possibility: namely, the surge in the P/C ratio on Friday, the lackadaisical response of the VIX to the market weakness, and the potential climactic low in XLF. However, toHHhe continued deterioration of the Ukraine situation over the weekend and a generally negative background pervading market psychology next week could be offsetting factors to the bullish signals. We’d better wait until Monday’s opening to give us a more firm indication as to what the market’s intentions are over the short-term.
For now, the short-term sell signal which was activated by the hourly indicators on Friday 4/4 remains in place. It was enhanced by a daily sell signal on Friday 4/11. The index will confirm an intermediate decline when it closes decisively under 1740. (Note that XBD is already in the process of breaking a comparative level, and that NDX is not far behind.)
+++++++++
FREE TRIAL SUBSCRIPTON
Market Turning Points is an uncommonly dependable, reasonably priced service providing intra-day market updates, a daily Market Summary, and detailed weekend reports. It is ideally suited to traders, but it can also be valuable to investors since highly accurate longer-term price projections are provided using Point & Figure analysis. Best-time reversal estimates are obtained from cycle analysis.
For a FREE 4-week trial, send an email to: info@marketurningpoints.com
For further subscription options, payment plans, weekly newsletters, and for general information, I encourage you to visit my website at www.marketurningpoints.com. By clicking on “Free Newsletter” you can get a preview of the latest newsletter which is normally posted on Sunday afternoon (unless it happens to be a 3-day weekend in which case it could be posted on Monday).
The above comments and those made in the daily updates and the Market Summary about the financial markets are based purely on what I consider to be sound technical analysis principles. They represent my own opinion and are not meant to be construed as trading or investment advice, but are offered as an analytical point of view which might be of interest to those who follow stock market cycles and technical analysis.

When Andre Gratian was a stock broker years ago, a friend introduced him to technical analysis of the market. Consequently, it is not an exaggeration to say that Andre fell in love with this approach! Ever since then, it has become an increasingly important part of his professional life. Gratian has studied the works of Wyckoff, Edwards & Magee, Edward J. Dewey (cycles) and many others. However, one of my most profitable undertaking has probably been to study Point & Figure charting, which he finds invaluable in analyzing stocks and indices. If he were restricted to one methodology, this is the one that he would choose. This well-rounded background has given him what he feels to be a special insight into the stock market, facilitating the recognition of meaningful patterns and the ‘turning points’ in all trends, whether they be short or long term. Andre feels very comfortable discussing the stock market and passing on meaningful information to others. His subscribers include individuals and money managers throughout the world. Moreover, his Newsletters are currently published on several financial sites, here and abroad.
More from Silver Phoenix 500


