Market Turning Points


Current position of the market
SPX: Long-term trend – In 1932 and 1974, the 40-yr cycle was responsible for protracted market weakness. The current phase is due this year, but where is the weakness? Has man (Federal Reserve) finally achieved dominance over universal rhythms or has it simply delayed the inevitable?
Intermediate trend – We are looking for the S&P500 move from 1905 to end, after which a much more serious correction should start. (It has probably started!)
Analysis of the short-term trend is done on a daily basis with the help of hourly charts. It is an important adjunct to the analysis of daily and weekly charts which discusses the course of longer market trends.
INTERMEDIATE DOWNTREND CONFIRMED
Market Overview
Market volatility has heightened considerably in the past few weeks as bulls and bears slug it out. This is normal at the beginning of an important downtrend, especially as the bears are beginning to take control of the trend. On Friday, SPX closed within 1 point of its August 1905 low. Breaking below would be the nail in the coffin and it looks inevitable. Several other indices have already surpassed their comparable lows including the NYSE which has the most stocks listed of any other US indices, decisively confirming the beginning of an important correction. Let’s look at internals!
Momentum: The weekly MACD has now moved well below the August low and is accelerating its negative divergence. This forecasts more weakness ahead. The daily MACD has followed suit by trading well below its August low and also accelerating its downtrend. The hourly MACD, not to be left behind, accelerated to the downside after a feebler attempt at turning up.
Breadth: The McClellan Oscillator tried briefly to become positive but got slammed back down into oversold territory. However, it did hold at a higher low and could be signaling the need for an oversold rally before we go much lower. As a result, the McClellan Summation Index has plunged to a new low, equaling the April 2013 bottom. What more proof is needed to show that we are in a confirmed intermediate down-trend? I want to point out, however, that on Friday, the raw A/D readings started to show some positive divergence, indicating that an oversold rally could be imminent.
VIX: VIX has now broken decisively out of its downtrend, achieving a high of 21.43 on Friday, well beyond its August high of 17.57. Keep in mind that the SPX has yet to break below its August low of 1905 although Monday’s early trading should demolish that landmark.
Structure: Can we deny any longer that primary wave IV is underway? Hardly! We can get a sense of what it is likely to do by comparing it to primary wave II which lasted 5 months and sent the SPX reeling some 250 points. Waves II and IV tend to be roughly similar in size.
Accumulation/distribution: I mentioned above that volatility at a market top was a sign of distribution. We can better estimate a target for the low of wave IV when SPX breaks below 1905. Everything above should be considered distribution.
Cycles: It is very possible that the low points of the long-term Kress cycles were simply delayed by the Fed’s easy money policy, which has made it a little more difficult to pin-point their lows. We should let the market do it for us. (There is no reason to alter this comment about cycles.)
Chart Analysis
I am going to leave last Friday’s charts in place and show you an up-dated version (courtesy of QCharts.com) so that you can see what has transpired over the past week.
The DOW (along with NDX) remains the strongest index but, as you can see, it has now closed below its (green) 30-wk MA for the first time since January of 2013. As for the other two, they are now not only well beyond their own 30-wk MA, but well past the August low, as well. In addition, the IWM, which tried to hold above its January 2014 low, has now fallen below.
Everything on these charts points to an acceleration of the decline.

Now, for a look at the daily SPX (courtesy of QCharts.com)!
On several occasions, I underscored the importance of the lower red channel line as the next level of support after the break of the intermediate trend line, and that it would be another sign of a significant downtrend starting, if broken. It took over a week to do it, but finally, on Friday, SPX plummeted below. Only the August low (one point below Friday’s close) remains to be breached! Note, however that more support at 1901 will be immediately available in the form of the 200-DMA. Let’s see if it holds.
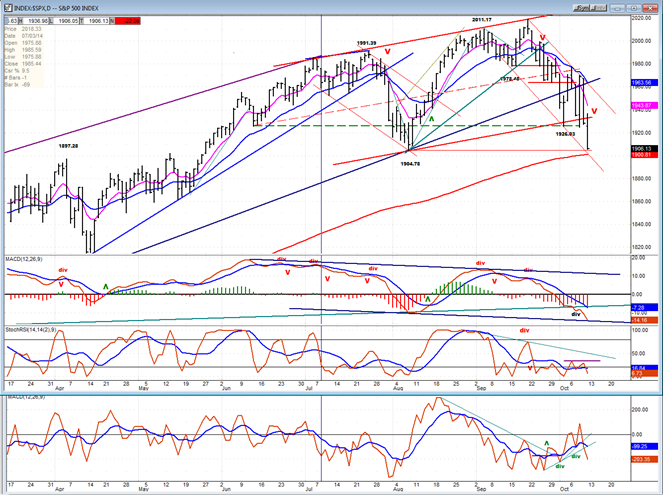
We also notice some positive divergence forming in both the daily SRSI and A/D oscillator. That should precede some form of bounce from this level before going lower, especially since the DJIA (above) has also reached its 200-DMA (not shown on that chart). As for the MACD, it may also find temporary support at the bottom of a downtrend channel.
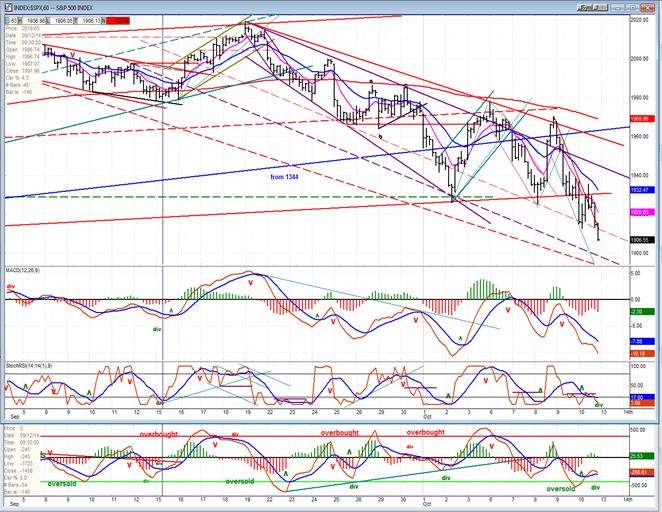
The hourly chart (also courtesy of QChart.com) portrays a decline which started with a relatively small range and has expanded into a large channel as volatility increased. The blue line represents the trend line from 1344 with prices gyrating around in an attempt to hold it. But with each spike getting weaker, on Friday it gave up the attempt entirely. At the same time, the lower line of the red channel (which had been the real point of short-term support) was decisively breached as selling increased materially and the decline began feeding on itself. The new support level has now moved to the bottom of the two channels (one within the other) which could quickly be reached on Monday morning.
Considering that breadth decreased on Friday and the lower indicator is now showing positive divergence, it is likely that we are coming to a short-term bottom and should be expecting a short-term rally. If it materializes, it could be sharp and brief, typical of a rally in a bear market, and similar to those which have taken place in the past few days. It could consist of a rally to the broken red channel line or a little higher before the downtrend resumes and possibly accelerates as it attracts heavier selling once the 1905 level has been bested.
 Breadth
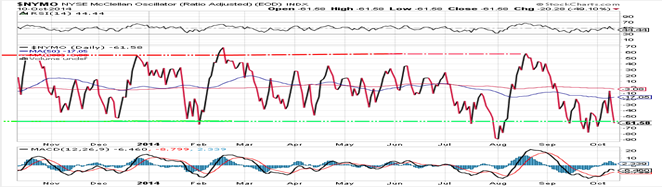
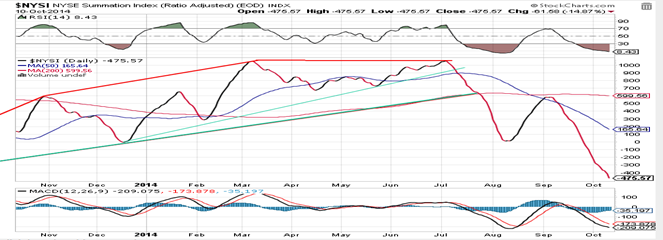
The McClellan Oscillator and the Summation Index appear below (courtesy of StockCharts.com).
The McClellan Oscillator made an attempt at rallying, but the last two days’ weakness was too much and it could not continue its uptrend and collapsed back down to the green line which often serves as a line of demarcation for temporary market lows. I am not sure that, considering the accelerating weakness in the market, it will be able to resume its uptrend decisively, but it could have another bounce along with the market for a day or two.
As a result, the summation Index has continued to drop, making lower and lower lows. At this time, “Where she stops, nobody knows!” The RSI is becoming very oversold, but cannot be compared to any of the other levels on this chart since the market condition has changed, materially.
Sentiment Indicators
The SentimenTrader (courtesy of same) long term indicator remains at a neutral 50. The fact that it remains neutral suggests that the market is not anywhere close to its low of the correction. It will take a reading of at least 40 -- perhaps 30 -- before indicating that we are approaching the low point.
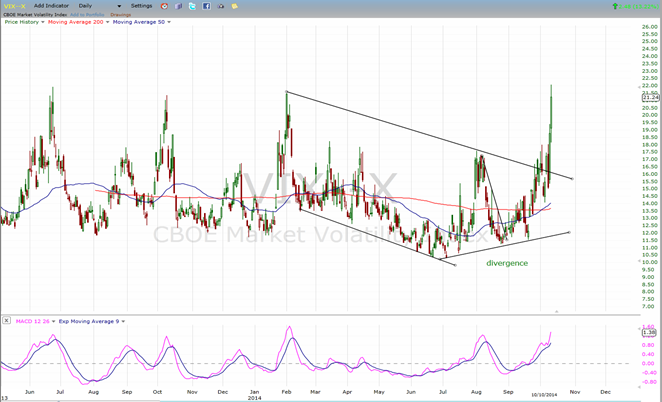
VIX (NYSE Volatility Index) - Leads and confirms market reversals.
Two months ago, VIX began to forecast the demise of the stock market’s uptrend by starting to move up while the market was making a series of new highs. Since this index normally runs contrary to the market, it was evidently trying to tell us something! In the past couple of weeks, what it was has become obvious; and woe to those who did not heed its warning. Now we must wait for the opposite to take place as it makes a lower high when the market makes a lower low, as it did in early 2009!
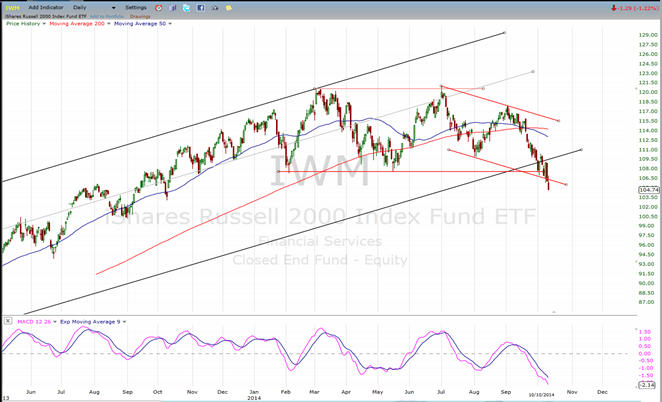
IWM (iShares Russell 2000) - Historically a market leader.
What was shaping up as a classic intermediate top in IWM turned out to be just that, and now the index is fully confirming the pattern and the amount of distribution that went into it. A rough way to estimate the extent of correction ahead would be to expect a decline equal to the width of the top formation.
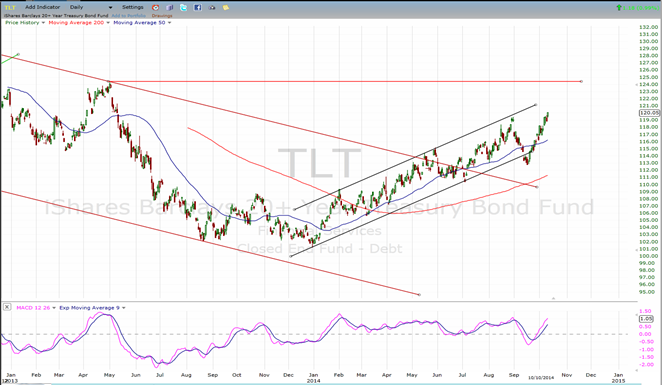
TLT (20+yr Treasury Bond Fund) – Normally runs contrary to the equities market.
TLT continues to portray the flight from stocks to bonds which started about 7 months before the market topped -- and continues! At some point, TLT will stop its ascending trend and it will be time to look for a low in the market decline. (Not yet! J)
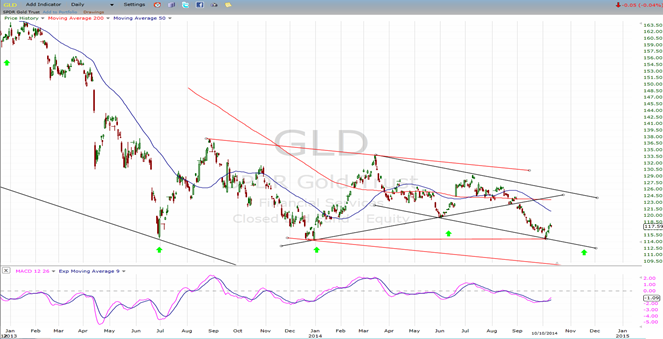
GLD (ETF for gold) – runs contrary to the dollar index.
It did not take any brain stress to figure out that GLD was ready for a bounce. It arrived at the bottom of a channel which coincided precisely with an important support level, and this gave a change in trend a 99% probability. But it should not be for very long; only as long as the dollar consolidates. Besides, the 25-wk cycle low is due in about a month!
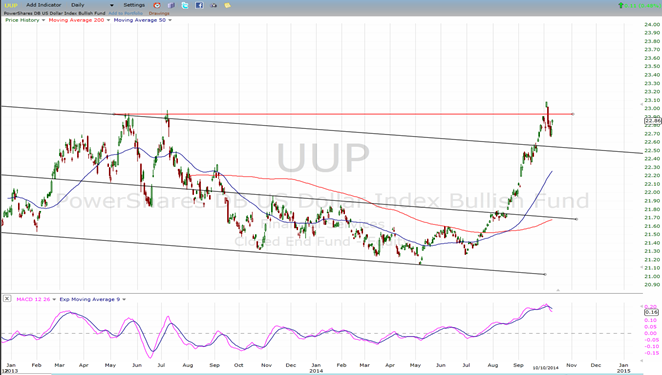
UUP (dollar ETF)
What looked like a sudden break-out in the dollar index was not. It was preceded by some eight months of preparation in the form of a base which suggests even higher prices. However, it is entitled to some consolidation before the uptrend continues.
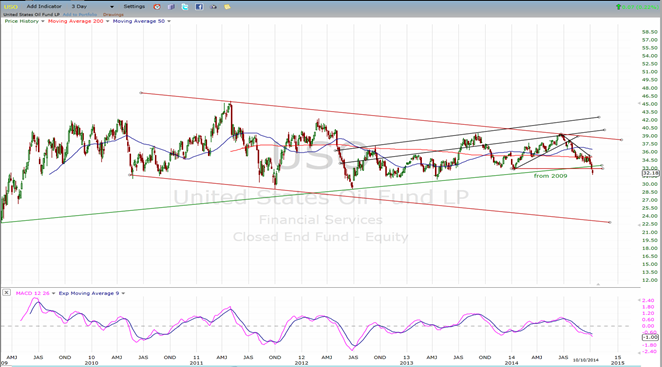
USO (US Oil Fund) (following chart courtesy of QCharts.com)
It seemed inevitable that USO would eventually break the bottom of its long-term trend line. Now that it has, I suspect that it will be heading for the bottom of its long-term corrective channel, in the low 20s, perhaps by the time that the dollar pauses around 90. But keep in mind that oil is also pressured by fundamental factors.
Summary
Even a week ago, there was still some uncertainty that SPX had started an important correction. This is no longer the case! The market action of the last few days shows that the downtrend is accelerating into what should prove to be a protracted decline of several months before it comes to an end. However, the structure intimates that this is most likely not the beginning of a bear market but only of a major correction similar to the one which took place between May and October 2001.
********
FREE TRIAL SUBSCRIPTON
Market Turning Points is an uncommonly dependable, reasonably priced service providing intra-day market updates, a daily Market Summary, and detailed weekend reports. It is ideally suited to traders, but it can also be valuable to investors since highly accurate longer-term price projections are provided using Point & Figure analysis and Fibonacci projections. Reversal estimates are obtained from cycle analysis, an increasing use of EWT for structural analysis, and a thorough understanding of conventional technical analysis
For a FREE 4-week trial, send an email to: info@marketurningpoints.com
For further subscription options, payment plans, weekly newsletters, and for general information, I encourage you to visit my website at www.marketurningpoints.com. By clicking on “Free Newsletter” you can get a preview of the latest newsletter which is normally posted on Sunday afternoon (unless it happens to be a 3-day weekend in which case it could be posted on Monday).
The above comments and those made in the daily updates and the Market Summary about the financial markets are based purely on what I consider to be sound technical analysis principles. They represent my own opinion and are not meant to be construed as trading or investment advice, but are offered as an analytical point of view which might be of interest to those who follow stock market cycles and technical analysis.

When Andre Gratian was a stock broker years ago, a friend introduced him to technical analysis of the market. Consequently, it is not an exaggeration to say that Andre fell in love with this approach! Ever since then, it has become an increasingly important part of his professional life. Gratian has studied the works of Wyckoff, Edwards & Magee, Edward J. Dewey (cycles) and many others. However, one of my most profitable undertaking has probably been to study Point & Figure charting, which he finds invaluable in analyzing stocks and indices. If he were restricted to one methodology, this is the one that he would choose. This well-rounded background has given him what he feels to be a special insight into the stock market, facilitating the recognition of meaningful patterns and the ‘turning points’ in all trends, whether they be short or long term. Andre feels very comfortable discussing the stock market and passing on meaningful information to others. His subscribers include individuals and money managers throughout the world. Moreover, his Newsletters are currently published on several financial sites, here and abroad.
More from Silver Phoenix 500


