Monetary Distortions Of GDP In 2021


This article explains the effect of monetary inflation on GDP. Nominal GDP is directly inflated by additional money and credit, so GDP growth is simply a reflection of additional money in the economy. It gives no clue as to the underlying economic situation. Whether the monetary planners know it or not, targeting GDP growth with monetary expansion is a tautology. They only succeed in covering up a deeper recession, the cost of which will become apparent subsequently as the currency’s purchasing power declines. And despite the wealth destruction being wrought by currency debasement, in the coming months we will see monetary expansion deployed more aggressively. An inflationary solution cannot succeed; but future GDP numbers will be artificially increased, encouraging policy makers to claim some success. But we should understand the simple relationship between increased quantities of money and the gains they impart to GDP, which will mislead macroeconomic analysts into thinking the economy is more resilient than it actually is.
Introduction
It is extremely rare to find any commentary on the relationship between monetary expansion and GDP. Yet since last March, when the Fed announced it would unleash unlimited quantities of dollars, it should have become the most important topic for economists and the financial press. Not a peep has been heard.
This extraordinary silence can only be explained by ignorance on the subject, presumably because none of the macroeconomists pouring out of global universities have ever had it set as a subject for research or debate in their dissertations.
The starting point in this voyage of discovery would have to be a taboo subject, Say’s law, which the Great God Keynes dismissed with a wave of his hand in order to invent macroeconomics. Why is it relevant? Because we produce in order to consume. And if we don’t do it, someone else has to produce and pay for us to consume. It is an iron law of the division of labour. In other words, with some limited differences, production is equal to the sum of consumption and deferred consumption (savings).
That is so long as the authorities don’t monkey around with the medium of exchange, the money. A healthy economy is not one that “grows”, but one that does not have its production and consumption interfered with. If the money is sound and its quantity unchanged there would be no change in GDP year after year. As producers, we would continue to anticipate and respond to the demands and desires of the consumer. We are all consumers as well. Those that are disabled from work are subsidised by their families and social groups. Those who become unemployed, always the consequence of misjudgement, have to think again and move on to gainful employment. This is Schumpeter’s creative destruction — a rolling process that is fundamental to satisfying demand where ultimately the consumer is king. It is fundamental to a healthy economy.
While it only happens partially today, it remains the base case when considering all economic topics. In denial of it the state has carved a role for itself, and thanks to Keynes, rewritten the economic rulebook by adding the macro prefix, writing out human activity and replacing it with aggregates and averages. The relationship between money — the temporary storage of our labour to be spent — and economic activity is now undeniably corrupted.
Figure 1 illustrates the relationship between GDP and the money supply by comparing the increase in GDP from its base level in 1980 to end-2019 with the increase in broad money, M2, and by deriving the difference between them. And it can be seen that over the long run the difference between the two, the third line which wobbles about zero, is insignificant.
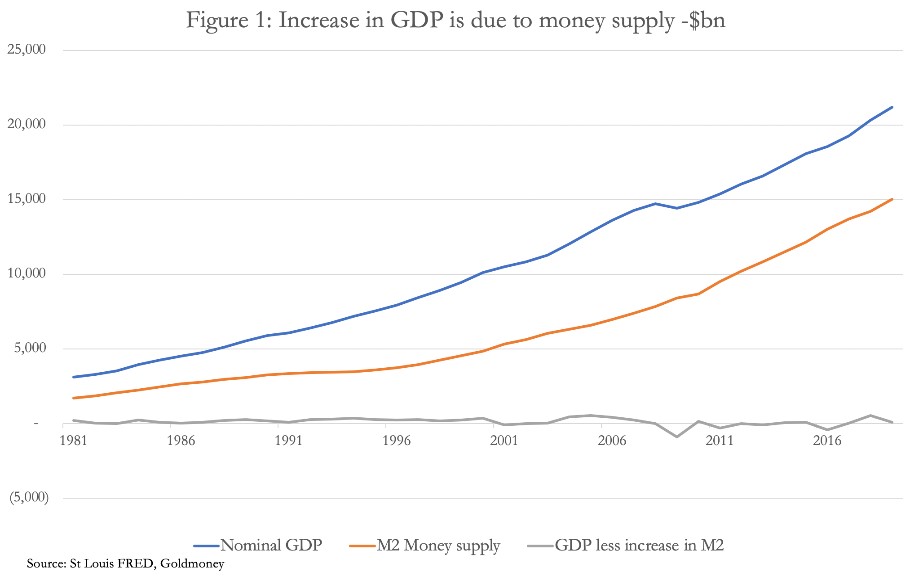
The reason is simple: “growth” in nominal GDP is only growth in the quantity of money, and has nothing to do with economic progress, which is what free markets deliver. The small variations in GDP less the increase in M2 are wholly due to the fact that GDP does not capture all economic activities, only those that are decreed eligible by the statisticians. If all transactions excluded from GDP were accounted for, variations in the difference would amount to a big fat zero.
Logic tells us this is so, but it escapes the neo-Keynesians — they are not strong on logic. And it leads to a simple but devastating conclusion: adjusted for increases in the money quantity, the US economy today measured by GDP is about the same size as it was in 1980, even allowing for changes in population. It is of course, a very different economy today. Despite the growing interference of government intervention and regulation, we have seen enormous progress in technologies, market trends and in our standards of living — all the product of the private sector despite the burden of non-productive, taxing, inflating, regulating and distorting governments.
It proves you cannot measure economic progress, only the amount of money used in transactions. The relevance to today’s events is that since last March, the quantity of money has been suddenly increased by the Fed, raising the issue posed at the beginning of this article. How will the GDP numbers be affected by massive money-printing? We know from Say’s law, that those of us still exchanging our production for the goods and services we need and want, will continue to do so. But given the destabilisation of covid-19 lockdowns, trade tariffs, and the desire of banks to reduce their over-geared balance sheets, the global economy is in a deep slump. The screenshot below, taken from America’s Bureau of Economic Analysis website shows the position in America.
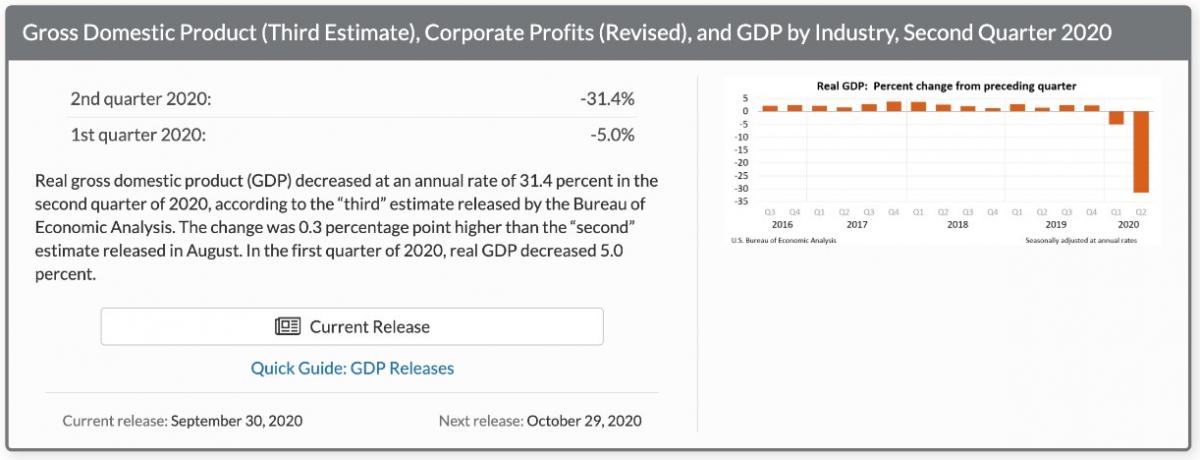
Before getting into the meat of our subject, it is worth noting that the true deflator of GDP should be the broad measure of money supply, not some fabricated CPI-related figure, as discussed above. Putting that issue to one side, we note that GDP collapsed by an annualised rate of over 31% in the second quarter of 2020, while at the same time M2 increased by 9.4%, an annualised rate of 37.6%. Given that we have shown how over the long run changes in nominal GDP are solely reflective of changes in the quantity of broad money, we can confidently state that the fall in last quarter’s GDP is despite the increase in the quantity of money, showing it does not appear to have been spent by producers and consumers. The question arises as to why.
One answer put forward is that the savings rate has jumped, as illustrated in the chart from the St Louis Fed’s FRED service.
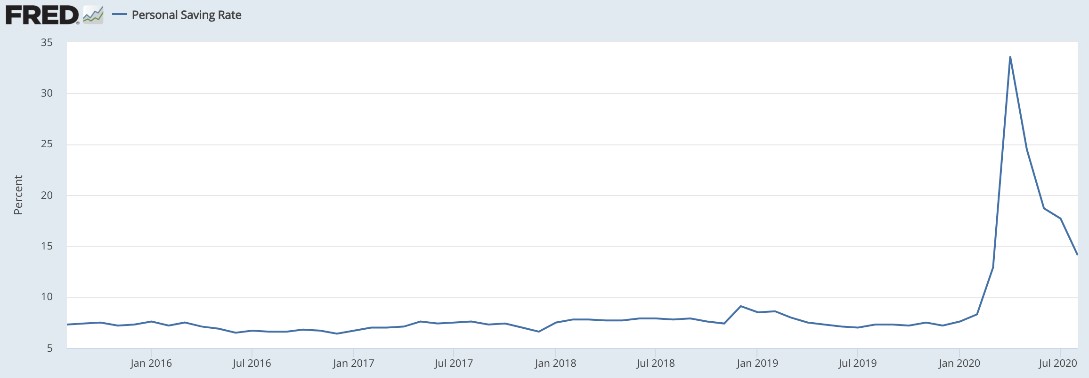
The chart reflects the collapse in spending when people locked down, as well as the $1,200 stimulus checks distributed to households at end-April, which marked the peak in the chart. It is assumed to be money saved, which will be spent when normality returns. Since April, there has been a downward adjustment, partly because some spending has returned. Being derived as the percentage of personal disposable income that is not spent and given the high levels of personal debt throughout the population, much of these so-called savings will have already disappeared into credit card and debt repayments — a credit contraction. It is also likely that with rising unemployment and roughly 80% of the American salaried population living from paycheque to paycheque before the virus, that far from there being a higher savings rate, personal finances have deteriorated so much that money is being withdrawn from savings on a net basis, just to acquire life’s essentials.
If we return to Say’s law for guidance, we will observe that the collapse in GDP is not just of consumption but also of production. We should add it is not the purpose of Say’s law to claim an exact statistical match between consumption and production, because there is always a lag between the increase of money supply and its wider circulation in the economy. But putting that aside, we should adjust the 31.4% annualised fall in the second quarter GDP by the annualised increase in M2 money supply of 36.4%. That tells us that in constant dollar terms the US economy contracted over the second quarter alone by an astonishing 56.4%. Therefore, while timing differences between the deployment of extra fiat money and its full reflection in GDP will deny this figure’s exactitude, the underlying economic situation is far worse than the headline figures show, and the effect of yet higher rates of money supply growth will only serve to further conceal the seriousness of the true position.
We know that monetary planners simply think that extra money should stimulate GDP. For them, the solution is always to increase the quantity of money more aggressively, assuming they can retain control over the price inflation statistics and interest rates. But it is like trying to start a damp fire with the last and equally damp match. Whether monetary planners are aware of it or not, additional money in circulation only adds to the GDP number while destroying the personal wealth upon which an economy thrives.
Applying money debasement to gross output
The scale of the task of rescuing the economy from a deepening slump is far larger than suggested by GDP alone. That which applies to the relationship between changes in the quantity of money and the GDP total also applies to gross output. Gross output includes the intermediate steps of production that make up the final products bought by consumers.
America’s gross output is a far larger figure than its GDP, about 1.7 times, even allowing for the fact the US economy is predominantly services based. Support for industry’s supply chains would therefore have to be far larger than implied by GDP alone by using monetary expansion. Figure 2 below shows the distribution of gross output over the US economy and how it has declined in the principal sector groupings over the first half of 2020, and these changes are then further adjusted for the increased quantity of M2 money supply.
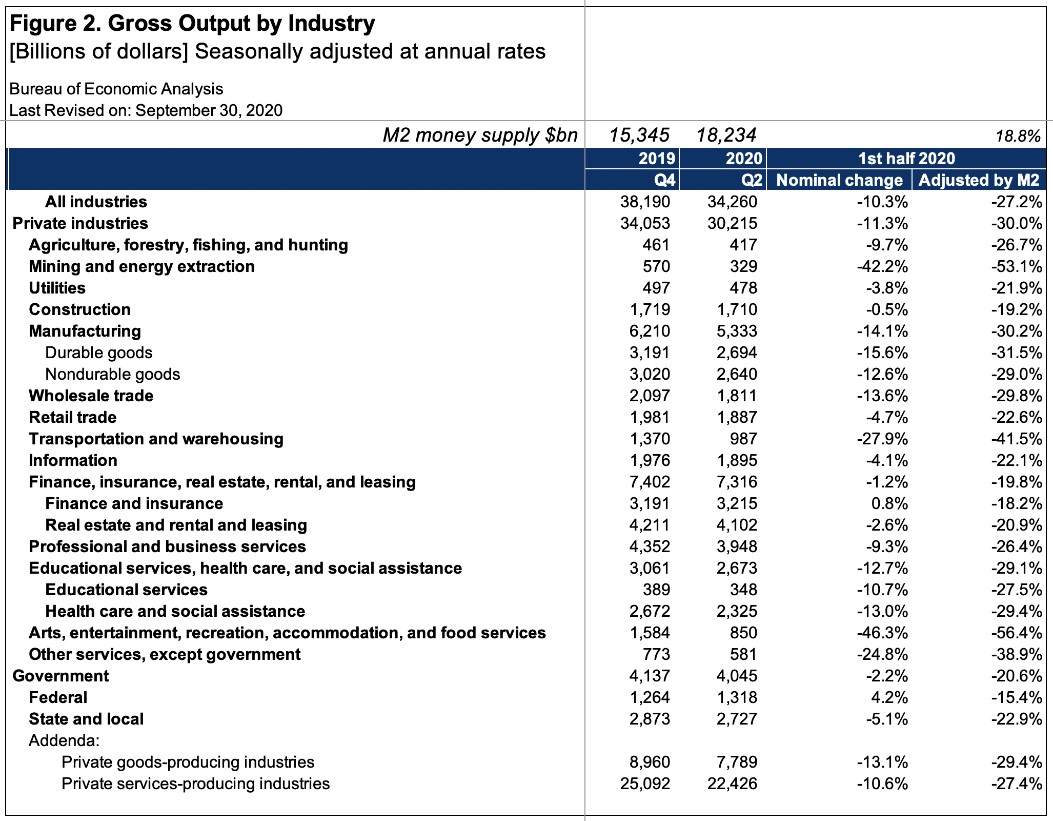
Important caveats are that the increase in M2 is assumed to apply in its entirety to GDP constituents, which is obviously not the case as long as there is spending not included, and that it applies evenly across gross output sectors, which is also not the case. But the adjustment for the increase in M2 money does serve to point out an overall effect, which would otherwise be ignored.
The numbers in the table are not annualised in the manner of the BEA’s assessment of GDP in the earlier screenshot because some of the falls are so extreme that they would show declines approaching or exceeding 100%. But clearly, it can be seen that even including the Federal Government sub-category, 2020 has been a disaster for all sectors of the US economy when the increase in M2 is taken into account.
Federal government spending has nominally increased, but when monetary inflation is allowed for it can never increase by enough to offset the dollar’s debasement. When we assume the future effects of the current debasement on the general level of prices, only then will the purely statistical nature of the recovery in nominal GDP become evident. But that will then raise the question as to whether inflationary monetary policies can continue without a substantial increase in interest rates.
Businesses will now be amending their internal forecasts for the rest of the year, in the light of changed conditions so far, as well as the apparent resurgence of the coronavirus. Given the uncertainties involved they will be protecting themselves by axing costs, including labour. Almost certainly, there will be a second wave of business contraction, provoking a new round of monetary stimulus — already in the wings but delayed over political arguments ahead of the presidential election. Furthermore, the signal to businesses from their bankers is that bank credit is increasingly hard to come by.
In terms of supply chains, the size of which is roughly what gross output reveals, the Fed will seek to inflate $30,215bn of private sector supply chains out of trouble. Given that so far monetary inflation has failed to stop private sector manufacturers’ output sliding by 11.3% in nominal terms in the first half-year, it appears we are only in the early stages of an accelerated burst of money printing.
Fighting the deflationary forces
Not only will the Fed need to support supply chains, but it will have to make up for any contraction of bank credit, so it is not just a matter of filling a monetary gap. Loans to businesses are already contracting as the screenshot below shows.
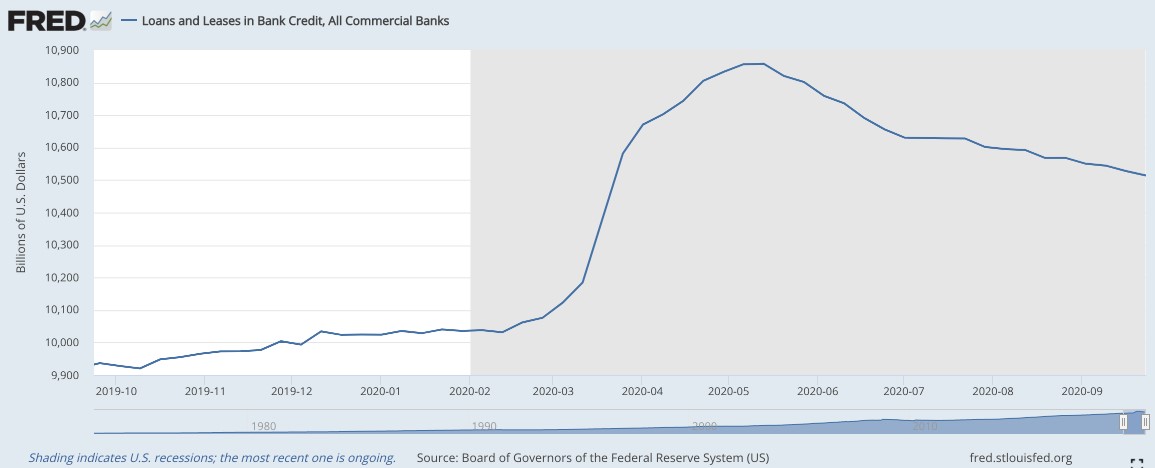
The $850bn expansion of loans and leases in bank credit commenced in mid-February, shortly after the recession was deemed to have started. At that point, companies were beginning to feel an economic wind-chill, and given their high levels of debt, banks had little alternative to providing extra funding of circulating capital for fear of triggering an avalanche of non-performing loans. The Fed was obviously aware of the gathering danger, cutting its funds rate from one per cent to zero, and on 23 March it issued an emergency FOMC statement promising unlimited monetary inflation.
The bulk of the rise in loans and leases was subsequent to the Fed’s actions in late-March. Presumably, the banks were put under the cosh by the Fed as part of the wider rescue package, and the banks knew they must increase their support for borrowers. Their share of the mostly junk-related collateralised loan market is enough to wipe out the banking sector’s capital on its own. No doubt the support given by the Fed to the corporate bond market through purchases by BlackRock is designed to ease bankers’ fears. But by mid-May a decline in commercial lending has set in as banks gradually began to protect their balance sheets.
Consumers are being squeezed as well. In the UK, banks have raised interest rates on arranged overdrafts to usurious levels of 40%, and where they can they have reduced credit card limits. Is something similar happening in the US? The answer appears to be yes, as the next chart from FRED shows.
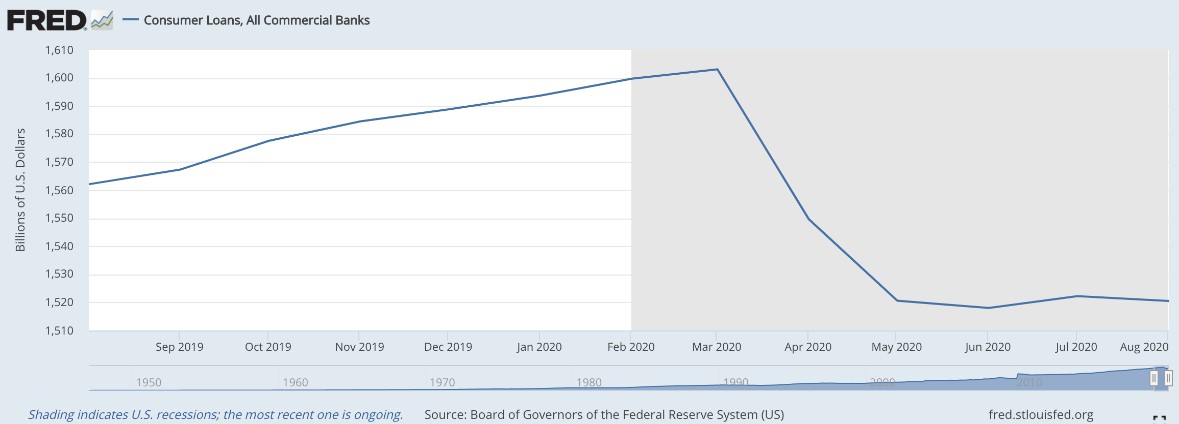
While busily funding struggling businesses, the banks were cutting loans to consumers. While the scale of it is different, the reduction in consumer loans makes it harder for businesses, particularly retailers, to survive.
Funding the deficit
Having embarked on a supply-side stimulus, the Federal Government entered the pandemic with a trillion-dollar budget deficit, which on CBO estimates in the last fiscal year turned out at $3.3 trillion. In the months from March to end-September it had been running at an annualised rate of $4.6 trillion. The new fiscal year, which commenced at the beginning of October, is likely to be at least as bad. The hope had been for a rapid V-shaped recovery, but that can now be ruled out, and as noted above, businesses have not finished cutting their costs.
Government spending is included in both GDP and gross output, so cuts in government spending are a headwind to the maintenance of GDP fallacies. For this reason, any cuts in government spending will be seen as counterproductive by the US Treasury. Government spending will therefore be likely increased significantly further as part of a package to keep pumping increasing quantities of money into the economy.
Increases in the general level of taxation can also be ruled out. While statistically they can be seen to be transfers within the overall economy, it makes no sense to government economists to stimulate production and consumption by adding money to private sector GDP and then taxing it away. Instead, they will almost certainly convince themselves that earlier supply-side policies must be adhered to and accelerated. And as we have seen, consumers have had money helicoptered into their bank accounts with more drops to follow.
Other fixes
Other ways to increase GDP than by monetary inflation include broadening its scope. If they are not included already, activities such as prostitution, gambling, drug-trafficking and alcohol and tobacco smuggling can be added and estimated, and therefore enhanced to bolster GDP. In the UK, the Office for National Statistics estimated in 2014 that these categories included with other amendments to GDP constituents would add between four and five per cent to GDP at 2009 prices.
A further addition to GDP would come from the abandonment of the cash economy, a process well underway and accelerated by the coronavirus. Watch out for government medical propaganda about how long the virus survives on banknotes and coins.
Summary and conclusion
The corruption of GDP numbers through accelerated monetary inflation is underappreciated and needs to be understood. When today’s inevitable and continuing debasement of the fiat currency is taken into account the economic destruction that has resulted is not only far greater than the headline figures for GDP suggest, but a continuation of inflationary policies only serves to bolster the statistic while the underlying economic condition worsens considerably.
This will not stop policy planners from pursuing inflationism. They may not realise it, but with such a dramatic contraction in their economies so far this year, the task of making nominal GDP appear to be robust by issuing limitless currency is a policy that cannot ultimately succeed. A second wave of the coronavirus is putting paid to hopes of a rapid economic recovery, which means that businesses have to face the reality of being overextended in a contracting business environment while their input prices rise due to monetary debasement.
The Fed has effectively committed itself to supporting all economic and financial activities with newly issued money. These include financing record budget deficits, underwriting supply chains, replacing contracting bank credit and supporting insolvent banks. Furthermore, it must ensure financial markets, particularly for government debt, remain strong, so that the interest cost of the US Treasury’s debt is contained close to the zero bound.
And finally, the Fed’s only real tool is the expansion of M1 money supply, which currently stands at $5.577 trillion. How many multiples of this figure will be required? Five, ten times, or even more?
Alasdair Macleod
HEAD OF RESEARCH• GOLDMONEY
Twitter: @MacleodFinance
MOBILE: +44 7790 419403
Goldmoney
The Most Trusted Name in Precious Metals tm
NEW YORK | ST. HELIER | TORONTO
Publicly Traded Symbols: CA: XAU | US: XAUMF
© 2020 GOLDMONEY INC. ALL RIGHTS RESERVED. THIS MESSAGE MAY CONTAIN CONFIDENTIAL OR PRIVILEGED INFORMATION. IF YOU ARE NOT THE INTENDED RECIPIENT, PLEASE ADVISE US IMMEDIATELY. THIS MESSAGE IS FOR GENERAL INFORMATION ONLY AND SHOULD NOT BE CONSTRUED AS AN OFFER OR SOLICITATION OF AN OFFER TO BUY SECURITIES OR ANY OTHER FINANCIAL INSTRUMENTS. WE DO NOT PROVIDE TAX, ACCOUNTING, OR LEGAL ADVICE, AND RECOMMEND THAT YOU SEEK INDEPENDENT PROFESSIONAL ADVICE IF NECESSARY. WE CONSIDER INFORMATION IN THIS MESSAGE RELIABLE BUT WE DO NOT REPRESENT THAT IT IS ACCURATE, COMPLETE, AND/OR UP TO DATE AND IT SHOULD NOT BE RELIED ON AS SUCH. OPINIONS EXPRESSED ARE OUR CURRENT OPINIONS AS OF THE DATE APPEARING ON THIS MESSAGE ONLY AND ONLY REPRESENT THE VIEWS OF THE AUTHOR AND NOT THOSE OF GOLDMONEY INC OR ITS SUBSIDIARIES UNLESS OTHERWISE EXPRESSLY NOTED.
Notice: This email may contain confidential or privileged information. If you received this email in error or believe you are not the intended recipient, please notify the sender immediately and delete this email without forwarding or opening any attachments. Thank you for your cooperation and attention.
********


