More Short-Term Uncertainty - Which Direction Is Next?


In our opinion, speculative short positions are favored (with stop-loss at 2,210, and profit target at 2,050, S&P500 index).
Our intraday outlook is bearish, and our short-term outlook is bearish. Our medium-term outlook is now neutral, following S&P500 index breakout above last year's all-time high:
Intraday outlook (next 24 hours): bearish
Short-term outlook (next 1-2 weeks): bearish
Medium-term outlook (next 1-3 months): neutral
Long-term outlook (next year): neutral
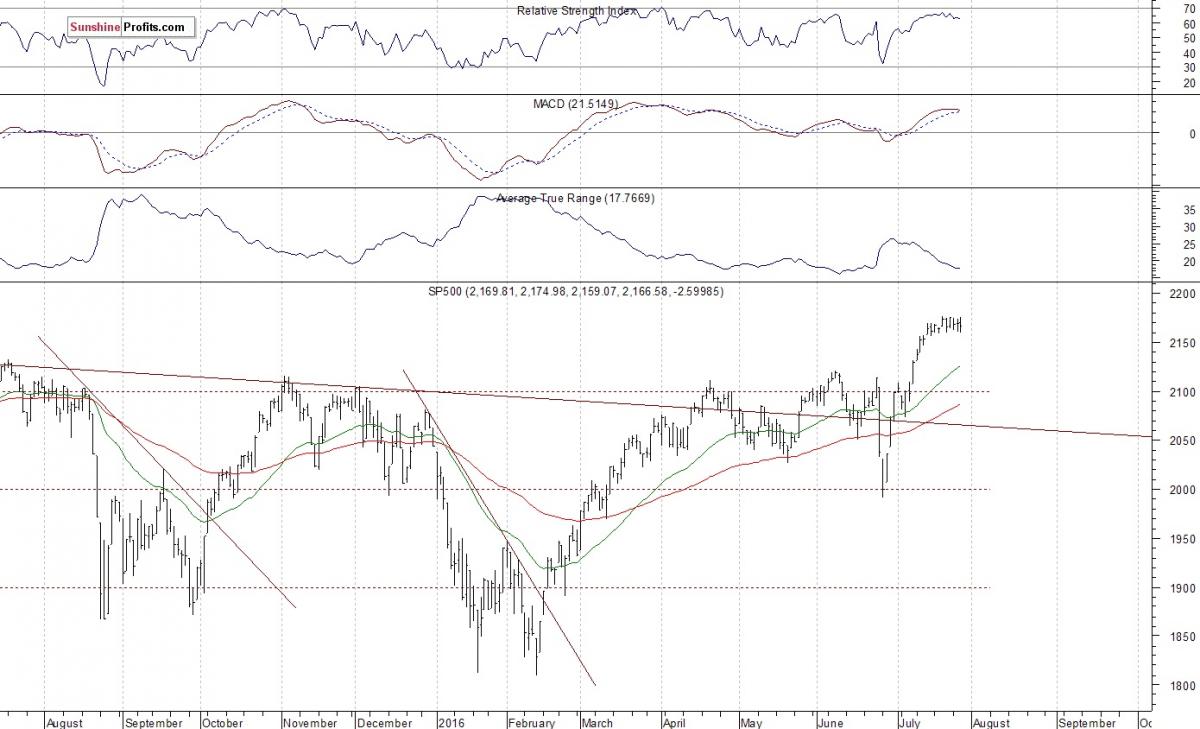
The US stock market indexes were virtually flat on Wednesday, as they extended their short-term uncertainty following recent rally. The S&P500 index continues to trade along its last Wednesday's new all-time high of 2,175.63. The nearest important level of resistance is at 2,170-2,175, and the next potential resistance level is at 2,200. On the other hand, support level is at around 2,150-2,155, marked by short-term local lows. The next important support level is at 2,130-2,135, marked by previous level of resistance. There have been no confirmed negative signals so far. However, we can see some short-term overbought conditions accompanied by negative technical divergences:
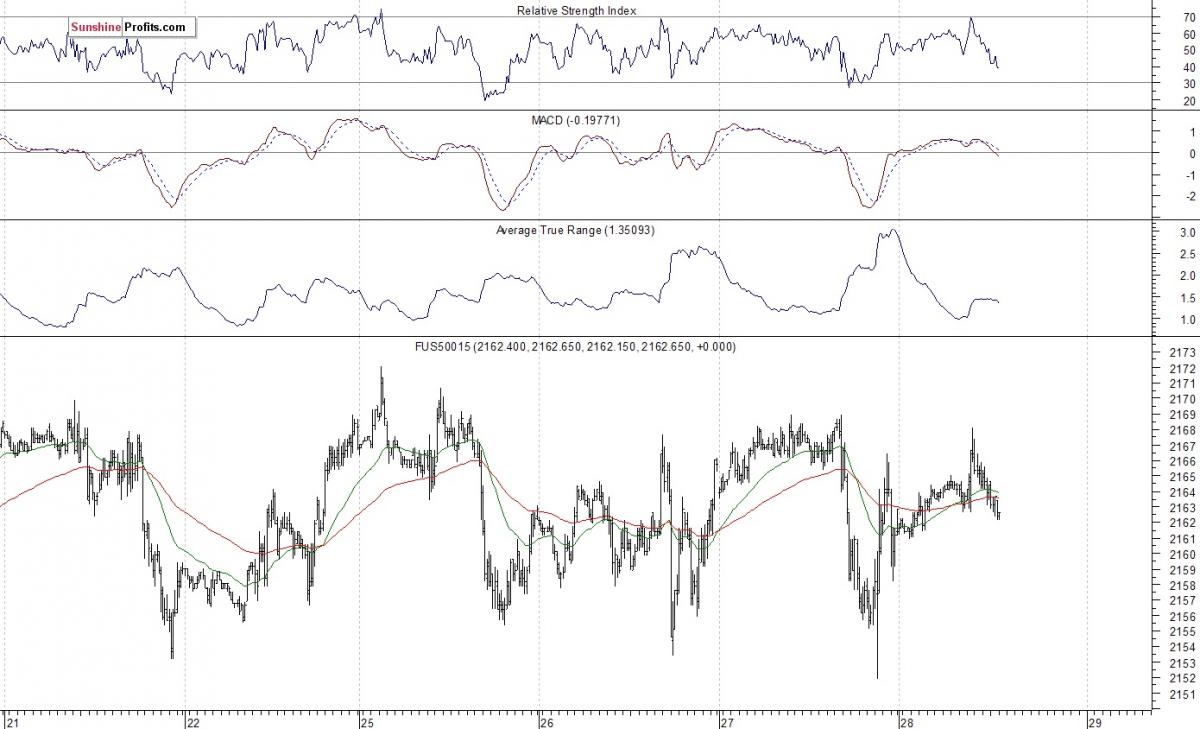
Expectations before the opening of today's trading session are virtually flat. The European stock market indexes have lost 0.1-0.2% so far. Investors will now wait for the Initial Jobless Claims number release at 8:30 a.m. The S&P500 futures contract trades within an intraday consolidation following yesterday's fluctuations. The nearest important level of resistance is at around 2,170, marked by short-term local highs. On the other hand, support level is at 2,150-2,160, as we can see on the 15-minute chart:
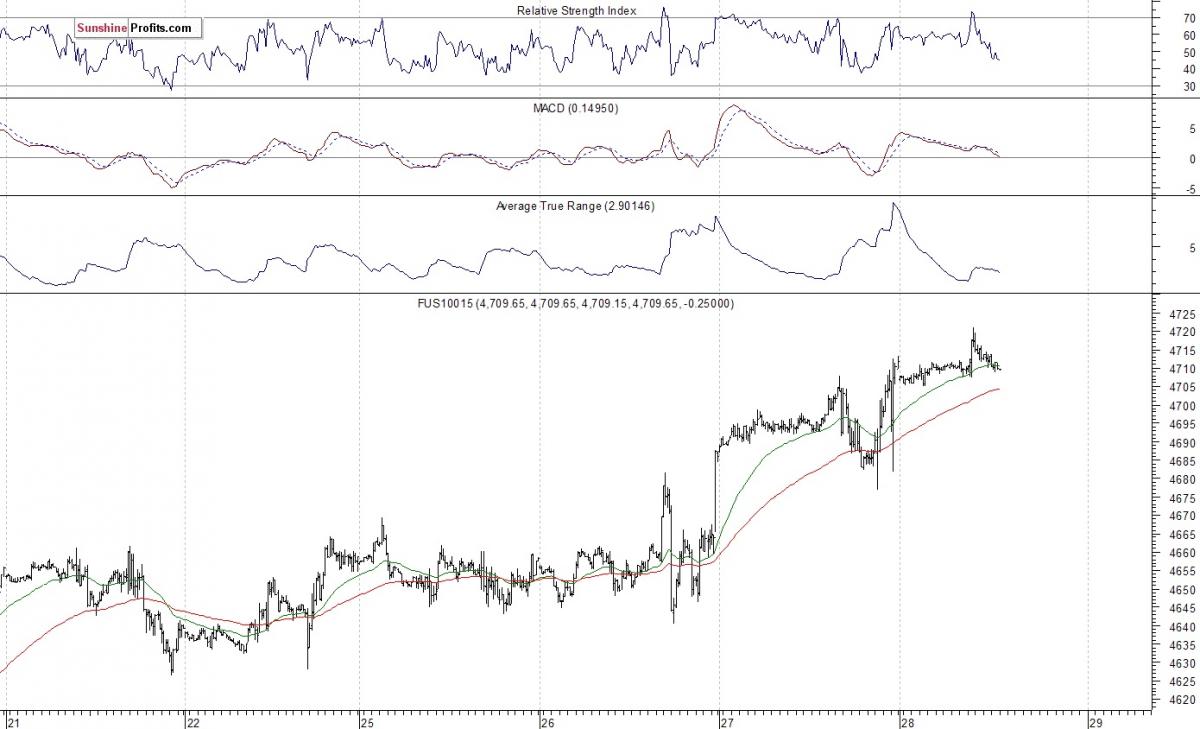
The technology Nasdaq 100 futures contract is relatively stronger than the broad stock market, as it currently trades above the level of 4,700, following better-than-expected quarterly corporate earnings releases. The nearest important resistance level is at around 4,720-4,740, marked by all-time high, among others. On the other hand, support level is at 4,680-4,700, as the 15-minute chart shows:
Concluding, the broad stock market extends remains within a short-term consolidation following recent rally. The S&P500 index continues to trade along its new record high of 2,175.63. We still can see short-term overbought conditions accompanied by bearish technical divergences. Therefore, we continue to maintain our speculative short position (opened on July 18th at 2,162, S&P500 index). Stop-loss level is at 2,210 and potential profit target is at 2,050 (S&P 500 index). You can trade S&P500 index using futures contracts (S&P 500 futures contract - SP, E-mini S&P 500 futures contract - ES) or an ETF like the SPDR S&P500 ETF - SPY. It is always important to set some exit price level in case some events cause the price to move in the unlikely direction. Having safety measures in place helps limit potential losses while letting the gains grow.
********
Paul Rejczak is a stock market strategist, who has been known for quality of his technical and fundamental analysis since the late nineties. He is interested in forecasting market behavior based on both traditional and innovative methods of technical analysis. Paul has made his name by developing mechanical trading systems. Paul is the author of Sunshine Profits’ premium service for stock traders: Stock Trading Alerts.
More from Silver Phoenix 500


