NDX: A Problem With Volume


The technology sector has been a leader of the market rally for almost a year, and this leadership has been manifested particularly in the Nasdaq 100 Index (NDX). However, the most recent push to new highs has been driven by a handful of mega-cap stocks (like Google), and in the process the volume picture has turned quite ugly.
The following chart shows two of our primary intermediate-term (IT) indicators -- the IT Breadth Momentum Oscillator (ITBM) and the IT Volume Momentum Oscillator (ITVM). This version of the indicators is calculated using only the component stocks of the NDX.
When the market rallies, we like to see the move confirmed by the internal indicators. What causes us concern is that the ITVM topped recently while the NDX was making new highs, creating a severe negative divergence. Another problem is that it topped below its EMA (more or less) , a situation that is very bearish.
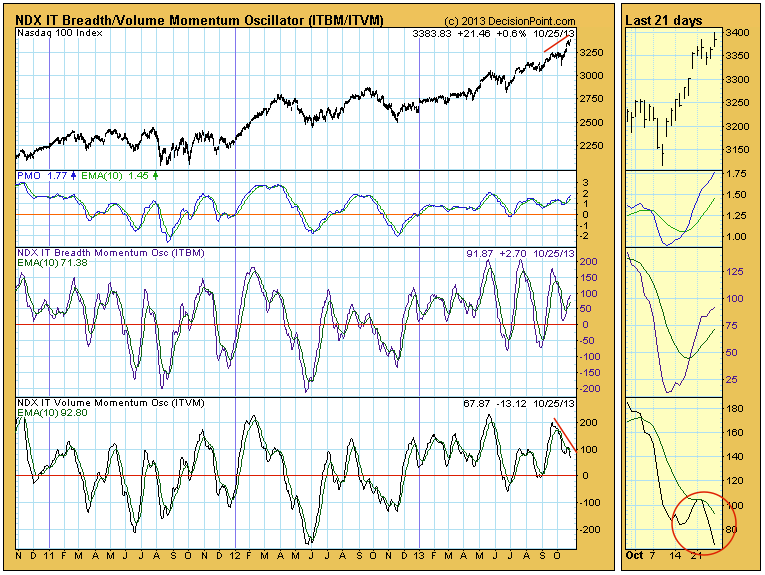
Conclusion: Obviously, oscillators oscillate, and every indicator top doesn't spell disaster for prices; however, we have a sharp upward price move and volume momentum is headed in the opposite direction. We think that a sharp downdraft in prices may be needed to get things back in gear. Presently we think this is a short-term issue.
* * * * * * * * * * * * * * * * * * * * *
Technical analysis is a windsock, not a crystal ball.
More from Silver Phoenix 500


