An Olympian’s Guide to the Market Selloff: Seeking Rewards In High-Risk Situations


Today I’d like to share a few words about the Olympics, but first, two words: Don’t panic.
The stock selloffs last Monday and Thursday were the two biggest daily point drops in the history of the Dow Jones Industrial Average, but in terms of percentage point losses, they don’t even come close to cracking the top 10 worst days in the past 10 years alone.
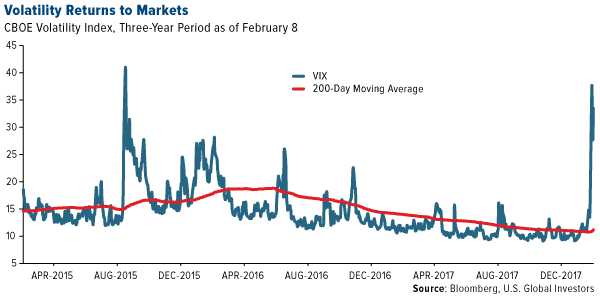
After a year of record closing highs and little to no volatility, it was expected that the stock market would need to blow off some steam. Last Monday, the CBOE Volatility Index, or VIX, surged nearly 116 percent, its biggest one-day increase since at least 2000.
As I explained last week, the selloff appears to have been triggered by a number of things, including the positive wage growth report. This stoked fears of higher inflation, which in turn raised the likelihood that the Federal Reserve, now under control of newcomer Jerome Powell, will raise borrowing costs more aggressively than expected to prevent the economy from overheating.
Also contributing to the uncertainty was news from the Treasury Department that the U.S. government plans to borrow nearly $1 trillion this year, compared to almost half that last year. In the first quarter alone, the Donald Trump administration will issue $66 billion in long-term debt, the first such boost in borrowing since 2009, as the U.S. Treasury seeks to cover budget deficits brought on by higher entitlement spending, not to mention the recently passed tax overhaul.
On Friday, the S&P 500 Index briefly plunged below its 200-day moving average before rebounding in volatile trading.
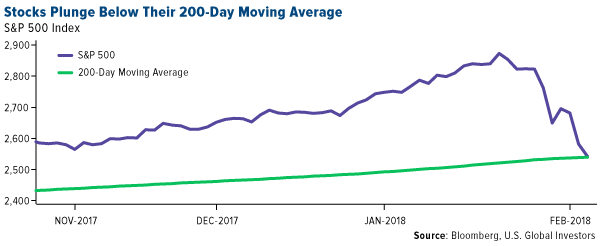
With stocks down 8 percent from its closing high on January 26, we’re close to entering correction territory. Historically, it’s taken four months for stocks to recover from a correction, according to Goldman Sachs analysis. By comparison, a bear market, which is generally defined as more than a 20 percent drop, can take up to two years.
I’m not saying a bear market is imminent—only that it might be time to reevaluate your tolerance for risk and, if appropriate, act accordingly. It’s times like these that highlight how important it is to be diversified in a number of asset classes such as gold, commodities, municipal bonds and international stocks.
Diversity Is Key in Volatile Times
I remain bullish on the U.S. market, but there will always be risk—even in a booming economy. This is one of the biggest reasons why I recommend a 10 percent weighting in gold and gold stocks, with additional diversification in commodities, international stocks and other asset classes.
But to get the greatest benefits, it’s important to rebalance at least once a year, based on your risk tolerance.
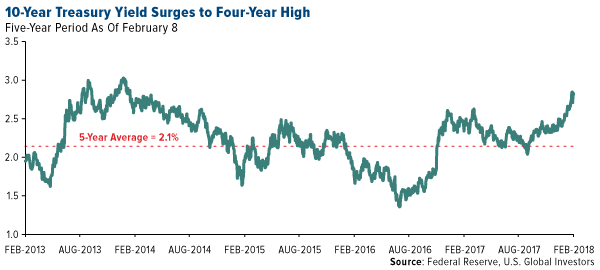
This week, gold was under pressure from surging Treasury yields. Since its 52-week low in September, the 10-year yield has increased almost 40 percent. Not only is it at a four-year high but it’s also above its five-year average of 2.1 percent.
Keep in mind that fundamentals remain robust. The U.S. economy is humming along. Unemployment is at a 17-year low, and wage growth is finally bouncing back after the financial crisis. The global manufacturing sector began 2018 on strong footing, with the purchasing manager’s index (PMI) registering 54.4 in January.
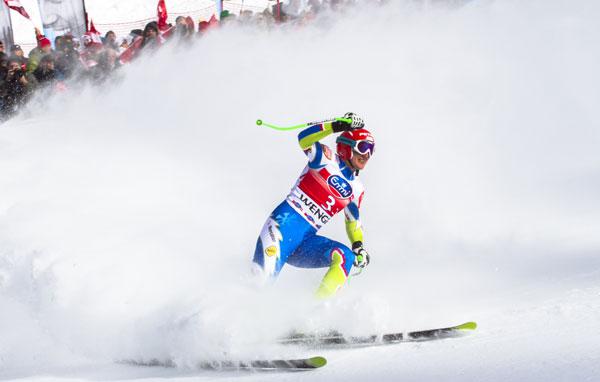
Like an Olympic cross-country skier, take the long-term approach and keep your eyes on the prize.
A Year for Olympic Record-Breaking
Before it even began, this year’s Winter Olympics was breaking records. A historic number of athletes, around 3,000, qualified to compete for an unprecedented 102 medals. For the first time ever, an African country—Nigeria—will be represented in the bobsled category, making this also the country’s first visit to the Winter Games. And not only is this South Korea’s first go-round hosting the Winter Olympics, but PyeongChang could be among the coldest host cities ever, with wind chills in some cases dropping temperatures to an arctic negative 25 degrees Celsius, or negative 13 degrees Fahrenheit.
One record that won’t be broken, though, is the cost to host the Games. South Korea spent an estimated $13 billion to bring the rugged, mountainous ski destination up to Olympic standards, building not just stadiums and arenas but also rail, roads, energy infrastructure and more. Amazingly, newly-constructed wind farms in Gangwon Province will generate more than enough energy to power the 16-day event, according to Hyeona Kim, a project manager with the PyeongChang Organizing Committee for the 2018 Olympic Games (POCOG).
Thirteen billion dollars sounds like a lot, but it pales in comparison to the record-breaking $50-55 billion Russia spent to host the Sochi Olympics in 2014.
Sochi Gets Soaked in Debt
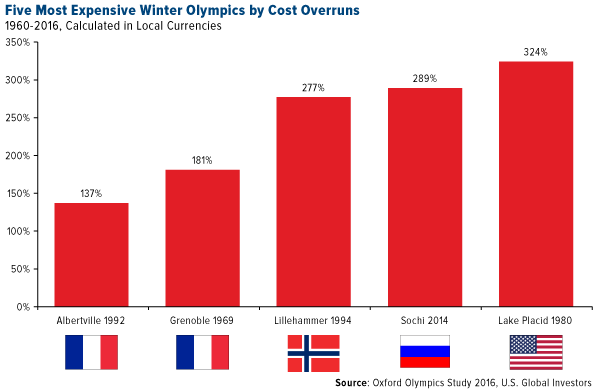
Sochi is not just the most expensive Olympics ever—Winter or Summer. Because Russia’s original price bid was $16 billion, it’s also among the most expensive in terms of cost overruns, according to a 2016 report by the University of Oxford. Looking just at Winter Games, only Lake Placid in 1980 has a bigger cost increase. (The 1976 Summer Olympics in Montreal is biggest of all at 720 percent over budget.)
To put Sochi’s overrun in perspective, the average cost per event is now estimated at $223 million, or a mind-boggling $8 million per athlete.
Contributing to the budget bust was Russia’s need to boost the region’s electricity capacity by as much as 800 percent, leading to the construction of 49 new energy projects. As one deputy minister put it, the undertaking was the country’s largest since Stalin’s time.
Of course, this all raises the question of what economic benefits, if any, hosting the Olympics brings to a city. It took Montreal 30 years to pay off its debt. The 2004 Summer Games in Athens—the birthplace of the Olympics—is now partially blamed for triggering the Greek debt crisis. And in Rio de Janeiro, Brazil, host of the 2016 Summer Games, a number of multimillion-dollar stadiums and arenas sit unused and have become eyesores. (PyeongChang, by contrast, plans to raze the stadium it built for opening and closing ceremonies after the Games are complete.)
Like any other type of investing, there’s no reward without some risk—and, as last week has proven, it’s all about how you manage it.
A Case Study in Good Financial Planning
One city that got it right was Los Angeles.
For many of you, California might not immediately come to mind as a shining example of good fiscal management. But when the city was awarded the Olympics for 1984, the reins were turned over to Major League Baseball (MLB) commissioner Peter Ueberroth, who had previously founded and run a successful travel company. Under his leadership, the 1984 Summer Olympics became the first privately financed Games. A committee was set up that operated more like a corporation. Financing came from private fundraising, corporate sponsorships, TV deals and more.
It certainly didn’t hurt that L.A. was already a highly developed metropolitan area with world-class infrastructure, but Ueberroth urged fiscal restraint and rationality. The results were better than anyone could have anticipated. Remember Sochi’s $8 million price tag per athlete? L.A. ended up spending only around $100,000 per competitor (in 2015 dollars), among the best records ever in Olympic history.
What’s more, the L.A. Games turned a tidy profit, netting the city more than $225 million, all of which was plowed back into the U.S. Olympic Committee. As recently as 2016, those profits were still helping athletes gear up for Olympic glory, according to Ueberroth himself.
In 1984, Ueberroth was selected as TIME’s Person of the Year for developing “a new model for the Games” and proving that “in a free society, anything is possible.”
Last week I had the chance to speak with Peter Smyrniotis of Market One Media Group about cryptocurrencies, blockchain technology and initial coin offerings (ICOs). Watch the interview by clicking here!
*********
All opinions expressed and data provided are subject to change without notice. Some of these opinions may not be appropriate to every investor. By clicking the link(s) above, you will be directed to a third-party website(s). U.S. Global Investors does not endorse all information supplied by this/these website(s) and is not responsible for its/their content.
The Dow Jones Industrial Average is a price-weighted average of 30 blue chip stocks that are generally leaders in their industry.
Chicago Board Options Exchange (CBOE) Volatility Index (VIX) shows the market's expectation of 30-day volatility.
The S&P 500 Stock Index is a widely recognized capitalization-weighted index of 500 common stock prices in U.S. companies.
The Purchasing Manager’s Index is an indicator of the economic health of the manufacturing sector. The PMI index is based on five major indicators: new orders, inventory levels, production, supplier deliveries and the employment environment.
U.S. Global Investors, Inc. is an investment adviser registered with the Securities and Exchange Commission ("SEC"). This does not mean that we are sponsored, recommended, or approved by the SEC, or that our abilities or qualifications in any respect have been passed upon by the SEC or any officer of the SEC.
This commentary should not be considered a solicitation or offering of any investment product.
Certain materials in this commentary may contain dated information. The information provided was current at the time of publication.
 Frank Holmes is the CEO and Chief Investment Officer of U.S. Global Investors. Mr. Holmes purchased a controlling interest in U.S. Global Investors in 1989 and became the firm’s chief investment officer in 1999. Under his guidance, the company’s funds have received numerous awards and honors including more than two dozen Lipper Fund Awards and certificates. In 2006, Mr. Holmes was selected mining fund manager of the year by the Mining Journal. He is also the co-author of “The Goldwatcher: Demystifying Gold Investing.” Mr. Holmes is engaged in a number of international philanthropies. He is a member of the President’s Circle and on the investment committee of the International Crisis Group, which works to resolve conflict around the world. He is also an advisor to the William J. Clinton Foundation on sustainable development in countries with resource-based economies. Mr. Holmes is a native of Toronto and is a graduate of the University of Western Ontario with a bachelor’s degree in economics. He is a former president and chairman of the Toronto Society of the Investment Dealers Association. Mr. Holmes is a much-sought-after keynote speaker at national and international investment conferences. He is also a regular commentator on the financial television networks CNBC, Bloomberg and Fox Business, and has been profiled by Fortune, Barron’s, The Financial Times and other publications. Visit the U.S. Global Investors website at http://www.usfunds.com.
More from Silver Phoenix 500


