Platinum Price…Sitting And Waiting For Liftoff


Summary
- Platinum is higher, but it continues to underperform other precious metals.
- The investment side can launch the price.
- A compelling case for a much higher price.
- A level to watch in platinum.
- PPLT is the most liquid ETF, but I still favor those bars.
Gold has been all the rage lately as the yellow metal has made a return to the front page of the financial news. Gold broke out of its $331.30 trading range dating back to 2014 to the upside in June. The price has moved to over $1500 per ounce and remained not far below its most recent high at $1531.40 on August 14 on the continuous futures contract.
In late 2015, the price of the yellow metal fell to a bottom at $1046.20 per ounce. At the $1515 level, gold is close to 45% higher than its low. In January 2016, platinum fell to a low at $812.20 per ounce. At $849.30 on August 14, the rare precious metal that formerly went by the nickname "rich person's gold" was under 4.6% higher than the 2016 low. While gold never traded under its late 2015 nadir, platinum had reached a lower low at $755.70 one year ago in August 2018.
There are more than a few reasons why the price of platinum should be substantially higher than its current price, but it is not. The most direct route for a risk position in platinum is via bars and coins offered by banks and dealers around the world. The futures market on the NYMEX division of the CME provides a mechanism for physical delivery of the precious metal. The Aberdeen Standard Platinum Physical Platinum Shares ETF (PPLT) provides an alternative to the physical and futures markets and is the most liquid ETF product for the metal.
Platinum is higher, but it continues to underperform other precious metals
This week is the first anniversary of when platinum fell to its lowest price since late 2003. The decline to a decade and one-half low took platinum to $755.70 per ounce during the week of August 13, 2018.
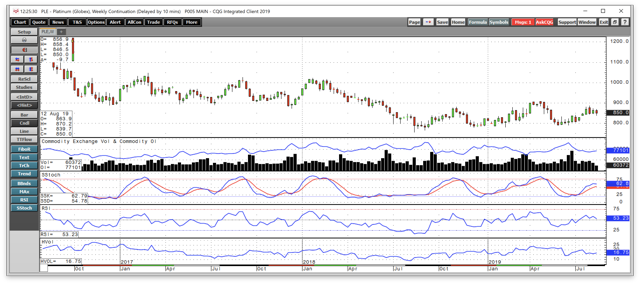
Source: CQG
As the weekly chart highlights, over the past year, the platinum futures market has made some upside progress. A pattern of higher lows and higher high has taken the precious metal futures that trade on the NYMEX division of the CME to the $850 level as of August 14. Technical resistance is at the late April peak at $907.90 per ounce.
Platinum remains at a deep historical discount to gold, palladium, and rhodium.
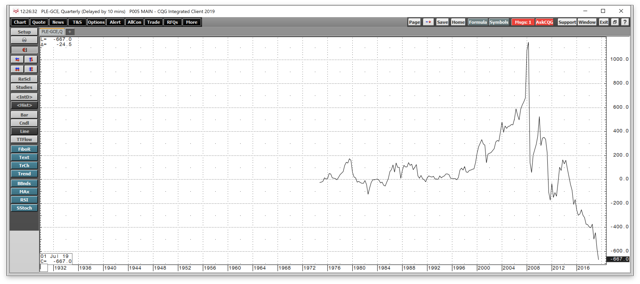
Source: CQG
As the quarterly chart illustrates, the metal that used to have the nickname "rich person's gold" was trading at an over $667 discount to the yellow metal on August 14. Platinum is at a record low when compared to the price of gold.
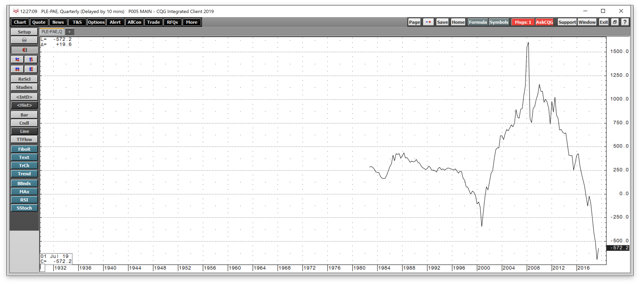
Source: CQG
While platinum has moved off its record low level against palladium at around $700 per ounce, at a $572 discount, platinum is at a historically low price compared to the other platinum group metal that trades on the NYMEX, palladium. The midpoint value for rhodium as of April 14 was at $3680 per ounce. In early 2016, the price of rhodium fell to under $600 per ounce. Platinum has moved from a $200 premium to rhodium to an over $2800 per ounce discount to the metal that is a byproduct of platinum output in South Africa.
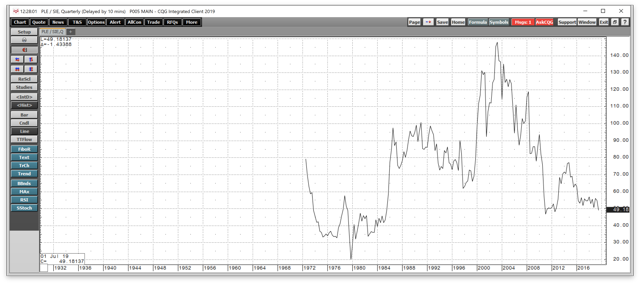
Source: CQG
Meanwhile, even though the price action in silver has lagged gold, silver has still outperformed the platinum market. The long-term average in the number of ounces of silver value in each ounce of platinum value dating back to 1972 is around 84:1. At 49.17:1 on August 14, silver was also historically expensive compared to platinum.
When it comes to all of the other precious metals, platinum remains cheap on a historical basis.
The investment side can launch the price
The value proposition for platinum against gold, palladium, rhodium, and even silver is compelling from an investment standpoint. With the precious metals back in fashion and gold on the front financial pages these days, platinum offers investors the most attractive alternative in the sector.
There is at least one sign that some investors are embracing investments in platinum these days.
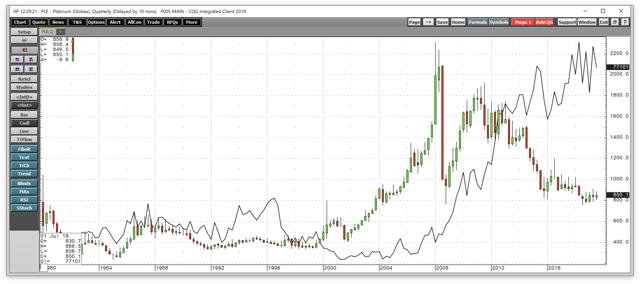
Source: CQG
The solid line on the quarterly platinum chart represents the total number of open long and short positions in the platinum futures market on NYMEX. In 2001, platinum open interest hit a low at 5,498 contracts. When the price rose to an all-time peak at $2308.80 in early 2008, the metric was at 11,864 contracts. Most recently, platinum open interest stood at 77,101 contracts, just under the record high from 2018 at 86,463 contracts.
The rise in open interest is a sign of increased investor interest in the platinum market, but not enough to lift the price to levels where it can compare with the other members of the precious metals sector.
Any substantial recovery in the price of platinum should come from investment demand for the metal. The higher the price of gold climbs, the greater the chance that platinum's price could explode to the upside.
A compelling case for a much higher price
While the investment case for platinum is convincing, the fundamental advantage for the metal is irrefutable. Platinum is more than ten times rarer than gold. The metal has a higher density and resistance to heat than any of the other precious metals, including the other two platinum group metals. As an industrial metal, platinum offers consumers a more durable metal at a lower price. The bottom line is that platinum offers consumers in the automobile, oil, and petrochemical as well as the fiberglass catalyst businesses an alternative to palladium and rhodium both of which are less dense and melt at lower temperatures.
While the investment case for owning platinum is attractive, the reasons for industrial users is conclusive.
A level to watch in platinum
Patience continues to wear thin for investors in the platinum market over the past five years as the price of the metal continued to underperform all of the other metals. An investment in gold, silver, palladium, or rhodium has awarded those who purchased the metal at lows in late 2015 or early 2016. Gold moved from $1046.20 to around the $1515 level as of August 14, 44.8% higher. Silver rallied from $13.635 to $17.23, a rise of 26.4%. Meanwhile, the price of palladium moved over three times higher from $451.50 to $1418.20 per ounce. Rhodium has exploded by over six-fold moving from $600 to $3680 per ounce over the same period.
It may be only a matter of time until platinum plays catchup with the other metals.
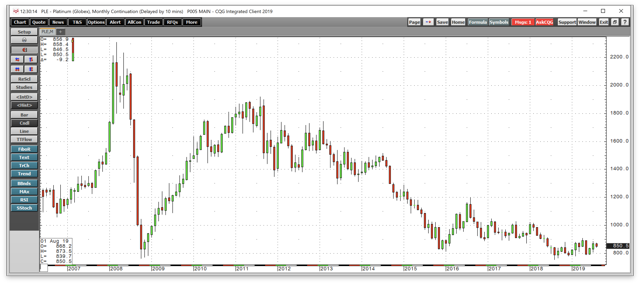
Source: CQG
The monthly chart shows that to break the pattern of lower highs and lower lows that has been in place since 2011 when platinum reached the $1900 per ounce level, the first level stands at $1022.60 per ounce, the early 2018 peak.
When markets break above a long-term critical level of technical resistance, they often attract trend-following buyers that take the price on a ride to the upside. The most recent example comes from the gold market that broke out of a five-year range. Gold traded above the $1377.50 resistance level during the week of June 17 and has since reached a high at $1531.40 just two months later. Gold is a far more liquid futures market than platinum. Open interest in gold futures on COMEX are almost sixteen times higher than in platinum because a platinum futures contract represents 50 ounces of the metal compared to a gold contract, which is for 100 ounces. Daily average trading volume in the gold futures market is approximately 400,000 contacts. In platinum it typically around 20,000 contracts. The size of the contracts means that gold is forty times more liquid than platinum each day.
The far lower level of liquidity is a reason why platinum could move on the upside when it breaks above a critical level of technical resistance. A herd of buyers descending on the platinum futures market would likely cause wild volatility. It is possible that sellers could not satisfy the demand for contracts in the futures or physical metal in the over-the-counter market. Under those conditions, the price could spike higher quickly to find equilibrium levels. Therefore, a technical break to the upside in the platinum market could cause a rally that is even greater than those seen in palladium and rhodium since early 2016.
PPLT is the most liquid ETF, but I still favor those bars
I continue to favor physical long positions in platinum bars and coins. However, one of the problems with the physical market is the irony that dealers often have a difficult time acquiring metal, which leads to significant premiums above the current market price for buyers. One way to avoid some of the costs is to purchase nearby NYMEX contracts and stand for delivery during the notice period. A buyer who takes delivery of platinum on the NYMEX receives a warehouse receipt that represents 50 ounces of the metal in an exchange-approved vault. A buyer has the right to take possession of the metal, which involves some costs. However, those expenses are often lower than the per-ounce premiums charged by dealers.
At $850.00 per ounce, one contract of NYMEX platinum has a value of $42,500. For those who do not venture into the futures market or choose not to take physical delivery, the Aberdeen Standard Platinum Physical Platinum Shares ETF is the most liquid platinum product available in the market. PPLT invests 100% of its net assets in platinum bullion. The fund summary states:
The investment seeks to reflect the performance of the price of physical platinum, less the expenses of the Trust's operations. The fund designed for investors who want a cost-effective and convenient way to invest in platinum with minimal credit risk. Advantages of investing in the Shares include Ease and Flexibility of Investment, Expenses, Minimal Credit Risk.
Each share of PPLT reflects one-tenth of an ounce of platinum bullion. The ETF has net assets of $642.86 million and trades an average of 89,063 shares each day. The ETF charges an expense ratio of 0.60%. Meanwhile, Granite Shares offers a competing product (PLTM), which reflects the price action of 1/100 of an ounce of platinum. While PLTM also holds 100% of its assets in platinum bullion. PLTM offers a lower expense ratio at 0.50%, but the net assets of $4.77 million make the ETF product less liquid than PPLT.
Precious metals are getting more precious each day with gold at over $1500 per ounce, silver at over $17, palladium at the $1430 level, and rhodium near $3700 per ounce. At the $850 level, platinum remains a screaming buy and a very frustrating metal for those of us watching a sector bull market that has yet to launch the price of the rarest metal of all.
The Hecht Commodity Report is one of the most comprehensive commodities reports available today from the #2 ranked author in both commodities and precious metals. My weekly report covers the market movements of 20 different commodities and provides bullish, bearish and neutral calls; directional trading recommendations, and actionable ideas for traders. I just reworked the report to make it very actionable!
Disclosure: I/we have no positions in any stocks mentioned, and no plans to initiate any positions within the next 72 hours. I wrote this article myself, and it expresses my own opinions. I am not receiving compensation for it (other than from Seeking Alpha). I have no business relationship with any company whose stock is mentioned in this article.
Additional disclosure: The author always has positions in commodities markets in futures, options, ETF/ETN products, and commodity equities. These long and short positions tend to change on an intraday basis.
*********
More from Silver Phoenix 500


