Price Of Silver – 100 Years In The Making


Sometimes fantasy becomes reality. At other times, a dose of reality will temper fantasies of outsized and unjustified proportion.
Some silver investors and analysts could use a dose of reality. Below is a chart of silver prices dating back to 1915…
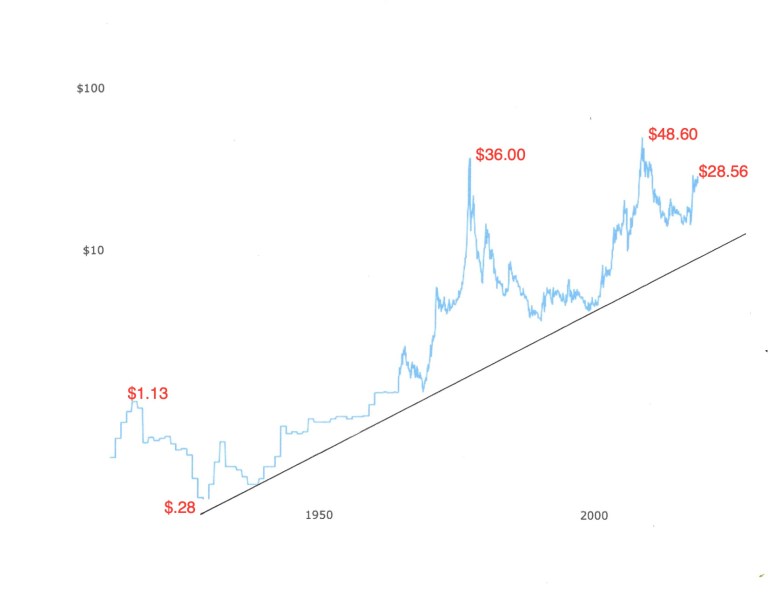
Silver Prices – 100 Year Historical Chart
SILVER PRICE HISTORY
In November 1919 the price of silver was $1.13 oz. From that point until mid-1932, silver declined sharply. By then it was down to $.28 oz.
The low price for silver in 1932 coincided with what proved to be Depression-era lows for the stock market. However, that is not entirely coincidental.
Silver is fundamentally, and foremost, an industrial commodity. Its price is primarily influenced by its use in industry. Its use as money is secondary to its role in industry.
The economic depression and deflation that took place resulted in huge downward price adjustments for most goods and services, including commodities.
Somewhat ironically, commodities were already experiencing their own “deflation” all during the Roaring Twenties. This was a full decade before the stock market crashed in October 1929.
The onset of the Great Depression simply accelerated silver’s price decline, along with other commodities.
After a sizable rebound and subsequent secondary low for silver, its price began a forty-year climb from $.35 oz. in 1940 to $36.00 oz. in February 1980. (Prices in the chart are monthly average closing prices.)
Silver prices declined by more than ninety percent after peaking in 1980, reaching a low of $3.56 oz. in 1993. For the next seven years, the price of silver languished at low levels and in 2001 traded as low as $4.00 oz.
The next ten years saw silver’s price move higher by twelve-fold, reaching $48.60 oz. ($48.70 intraday) in 2011.
Beginning just after it peaked in 2011, silver began a price decline that exceeded seventy percent. The low point was $11.77 oz. in March 2020.
Silver’s price rebounded to just under $30.00 oz. in August 2020 and again in February 2021. Currently, silver is priced at $25.55 oz.
OBSERVATIONS AND PERSPECTIVES
Looking at the chart above, one might get the impression that silver is in a (very) long-term bull market. Its price has continued to increase for decades and and the ninety-year trend appears well-supported.
The primary progression higher, however, occurred in the earlier years between 1940-80. Since 1980 there is more extreme volatility, both up and down, and less of the trending, higher price action seen previously.
The extreme volatility makes it more difficult to invest in silver with much confidence for the longer term. It also indicates a possible need for more reliance on timing, rather than time.
For example, if you had bought silver at $36.00 oz. in 1980, you would have had to endure thirty-one years of lower prices before exceeding your purchase price in early 2011. If you held on (which means sitting through a ninety percent decline) and then sold at $48.00 oz. you would have a profit of thirty-three percent. Of course, the annual rate of return is only one percent.
A one percent annual return doesn’t even match the loss in purchasing power resulting from inflation.
That’s the good news.
The next chart illustrates how deceptive and inadequate silver’s long-term price increases are…
Silver Prices (Inflation-Adjusted) 100 Year Historical Chart
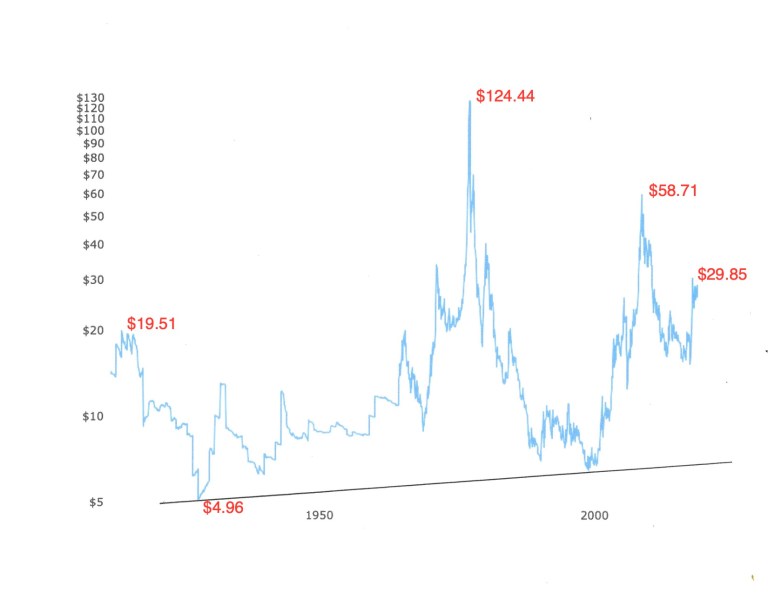
As you can see, the peak price for silver in 1980 – $36.00 on the first chart – is now $124.00 oz.
What this means is that in inflation-adjusted terms, buying silver at $36.00 oz. in 1980 and selling at $48.00 oz. in 2011 resulted in a real loss of fifty-three percent.
Or, you can say that the silver price today needs to be at $124.00 oz. to match its peak average closing price of $36.00 oz. in 1980.
Silver’s intraday peak price of $49.45 oz. in January 1980 was an all-time high. It has not been exceeded since; either in nominal or inflation-adjusted terms.
In real (inflation-adjusted) terms, the price of silver today is only 1/5 of what it was in January 1980. In plainer terms, $1.00 invested in silver in January 1980 is worth only $.20 today. ($124.00 oz. in 1980 compared to current price of $25.55)
In November 1974, the price of silver was $4.85 oz. The current silver price of $25.55 oz. represents a five-fold increase, or four-hundred percent.
Unfortunately, a four-hundred percent increase over 47 years doesn’t yield any profits. In inflation-adjusted terms, the current silver price of $25.55 is the equivalent of $4.85 oz. in 1974.
Finally, if silver suddenly rocketed higher to $125.00 oz., it would only be matching its 1980 high. That’s a lot of water under the bridge in 41 years just to break even.
CONCLUSION
Having some silver coins on hand offers some peace of mind against the possibility of currency collapse and civil unrest.
Investing in silver, however, is ineffective as a long-term monetary hedge because silver does not hold its value.
Crazy predictions for much higher silver prices are unwarranted and unsupported by historical performance.
(also see Are Silver Prices Really Cheap; And Does It Matter?)
Kelsey Williams is the author of two books: INFLATION, WHAT IT IS, WHAT IT ISN’T, AND WHO’S RESPONSIBLE FOR IT and ALL HAIL THE FED!
********

Kelsey Williams has more than forty years experience in the financial services industry, including fourteen years as a full-service financial planner. His website, Kelsey's Gold Facts, contains self-authored articles written for the purpose of educating and informing others about gold within a historical context. In addition to gold, he writes about inflation and the Federal Reserve.
Kelsey is the author of two books: INFLATION, WHAT IT IS, WHAT IT ISN'T, AND WHO'S RESPONSIBLE FOR IT and ALL HAIL THE FED!
Kelsey Williams is available for private consultations, public speaking, and interviews at kwilliams@kelseywilliamsgold.com
More from Silver Phoenix 500


