Review Of Massively Successful Tech, PUTS Trade – And Why The Market Has Probably Hit A Buttom Here…


This article was conceived as a “souvenir article” to assist those of you who did the trade - and I know from feedback that a significant number of you did - in gloating at its glorious success – but here’s the thing, working on it turned up some valuable insights that we can turn to our advantage in the immediate future. You will soon see what I mean.
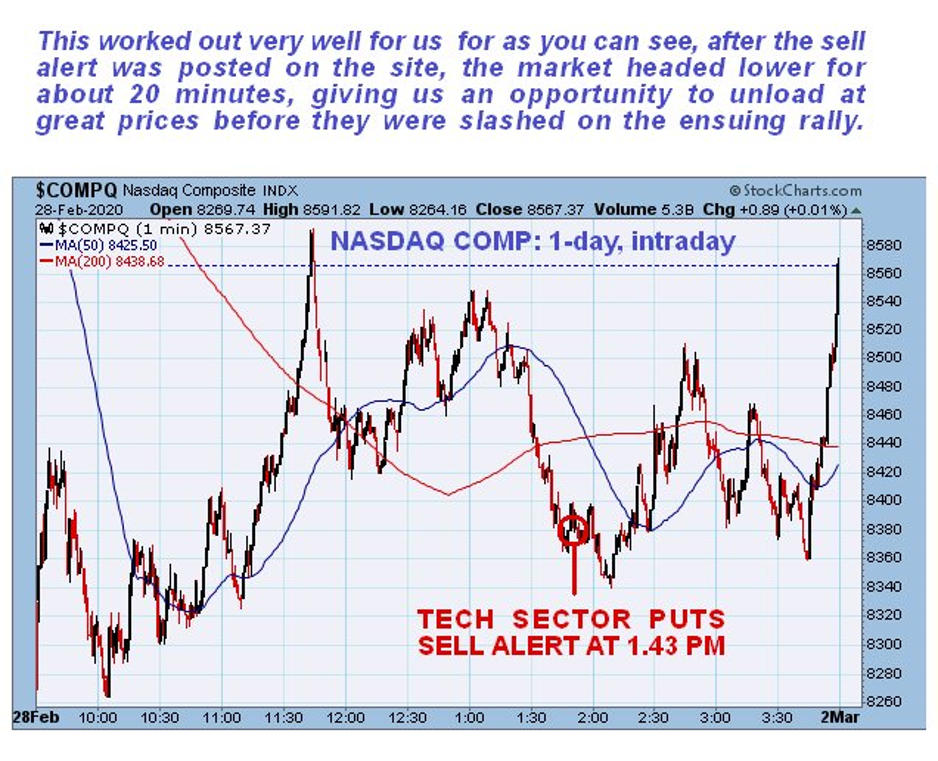
As Friday wore on I became more and more uncomfortable about sticking with the Puts, on account of the by then massively oversold condition of the market after 5 straight days of dropping like a rock, and, aware that after such a week, reversals often happen at or around the weekend, I figured that “a bird in the hand is worth two in the bush”, and so waited for what I thought was a good point for us to offload our Puts for the best prices possible. On the 1-day intraday chart for the NASDAQ Composite index shown below we can see that we missed the best chance, which was at about 10 in the morning, but fortune was kind and threw up a 2nd opportunity in the early to mid-afternoon, and so an alert was sent out at about 1.45 pm EST to take profits in all Puts , after which the sector continued to drop for about another 20 minutes, so if you moved quickly you would have been able to get out at excellent prices, and I know that some of you did. After zigzagging around the market rallied into the close and finished near to the highs for the day on huge volume. So what happened? – what does this action portend?
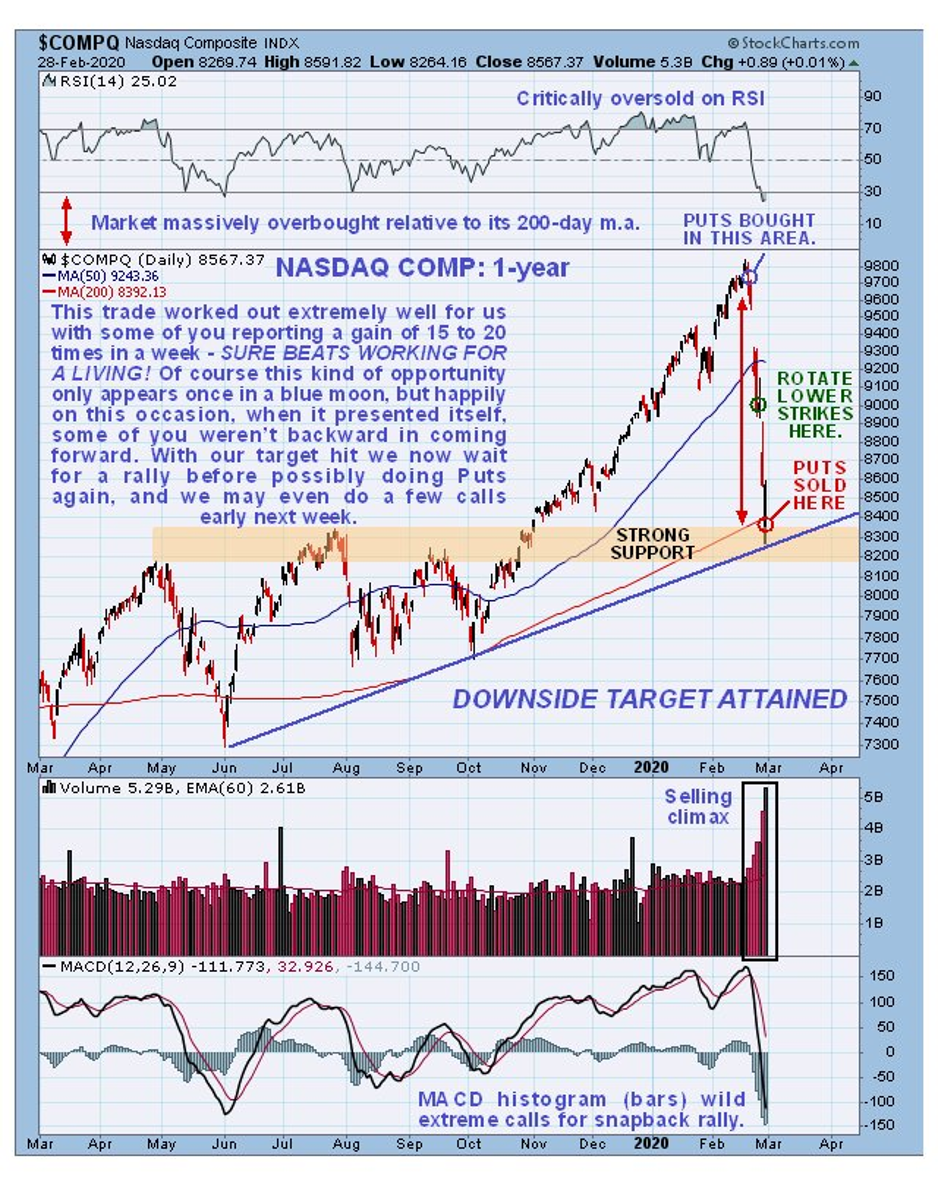
We can best see exactly what was going on using the 1-year chart for the NASDAQ Composite. On this chart we can see that the steep decline last week stopped exactly at a trendline target, which the market arrived at in a massively oversold state and on climactic volume, and it coincidentally arrived at a zone of strong support arising from trading at and below this zone from April through October. So this is clearly a good point for the rout to stop.
It is thus most interesting to observe on the 3-month chart for the NASDAQ Composite the sort of candle that formed on Friday – it was a big white shaven bottomed candle of a type known as a “belt hold line” or a “white opening shaven bottom” and a large white candle like this appearing after a severe and precipitous decline is bullish and a sign of a reversal, at least for the short-term, especially when it occurs on heavy volume as this did, and especially as it occurred at the rising 200-day moving average. What this means is that we shouldn’t just have liquidated our Puts – we should have placed a modest portion of the proceeds immediately into Calls. That is easier to see now but in the heat of battle it was not so obvious.
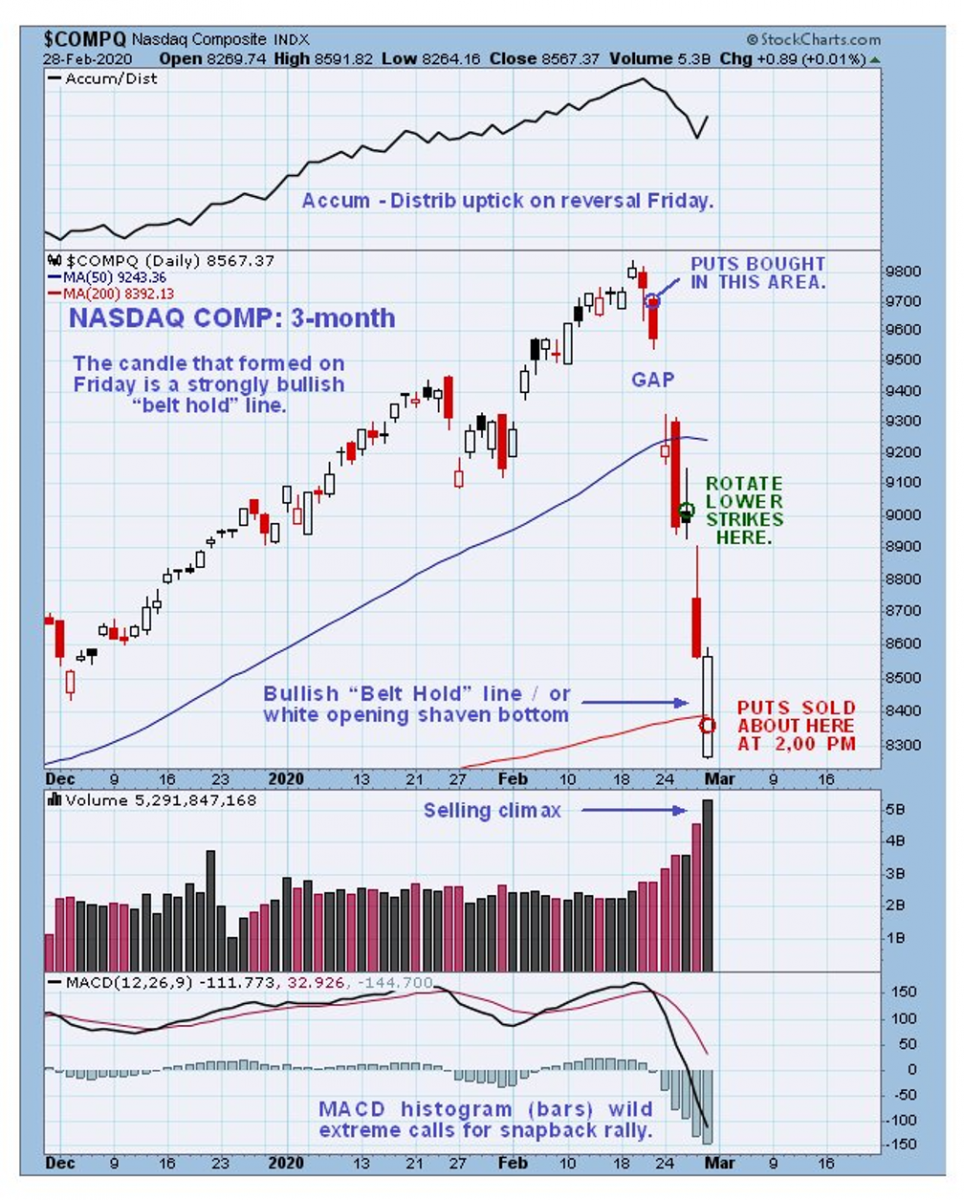
If fortune is kind to us again, the market will zigzag around on Monday below Friday’s close, perhaps dipping during the morning, enabling us to do some Calls at reasonable prices, for the scenario predicated by the action on Friday is a relief rally that should be big enough to make a good profit in Calls. Such a rally could be triggered by the market starting to smell an emergency 1% rate drop in the offing, for example, since Trump will do anything to resuscitate the market.
The idea to short the Tech sector crystallized when we reviewed a compelling body of evidence that pointed to an imminent market crash.
Now we will proceed to gloat at, er, I mean look at, the 3-month charts for Apple and Microsoft, in which we made massive profits in Puts in a very short space of time.
Starting with Apple, we see that we bought the Puts at the optimal time, right before the crash started. It was suggested to rotate to lower strikes at about hallway down at the point shown, the reason being to safeguard most of our gains in the event of it snapping back higher. That didn’t happen so it was a shame we did that as we lost the gains that accrued between the old and new strikes. Nevertheless, we still came out of it with massive profits, and I know that some of you toughed it out without rotating into lower strikes, an approach that paid off.
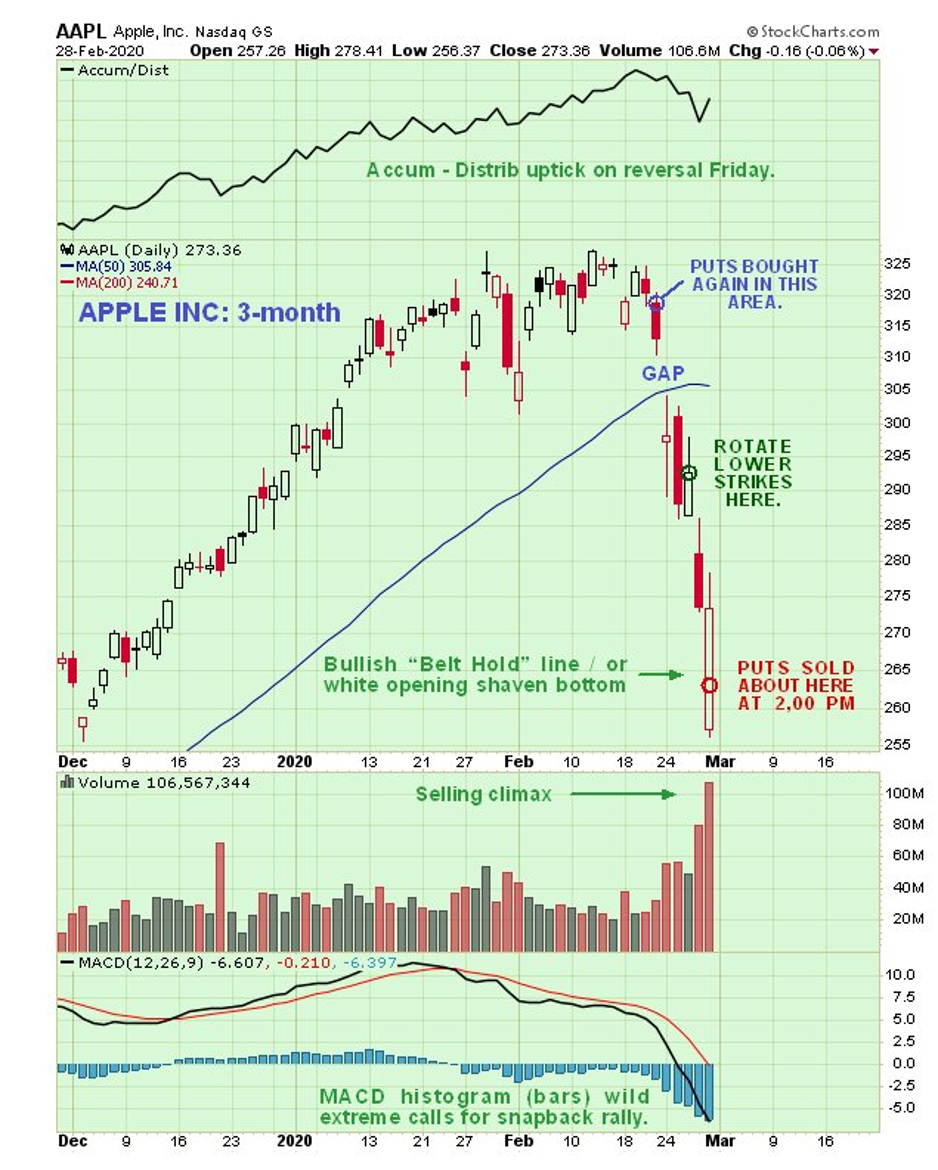
Now here’s where the fun gets even greater as we look first at where we bought the Puts, which were the March 20th expiring $300 strike, and we also did the $295 strike a little later…
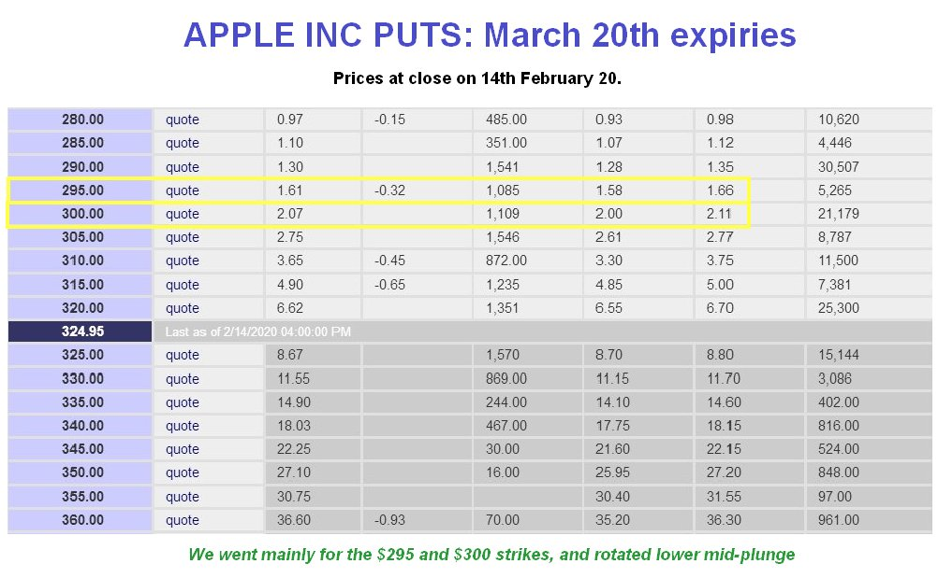
Now see where they finished on Friday. The $300 has risen nearly 15-fold, and in fact we got more than that as we sold at about 2.00 pm when prices were considerably better. Apple finished Friday with a large bullish “belt hold line” white candle on massive volume, which is viewed as a sign of at least a temporary bottom.
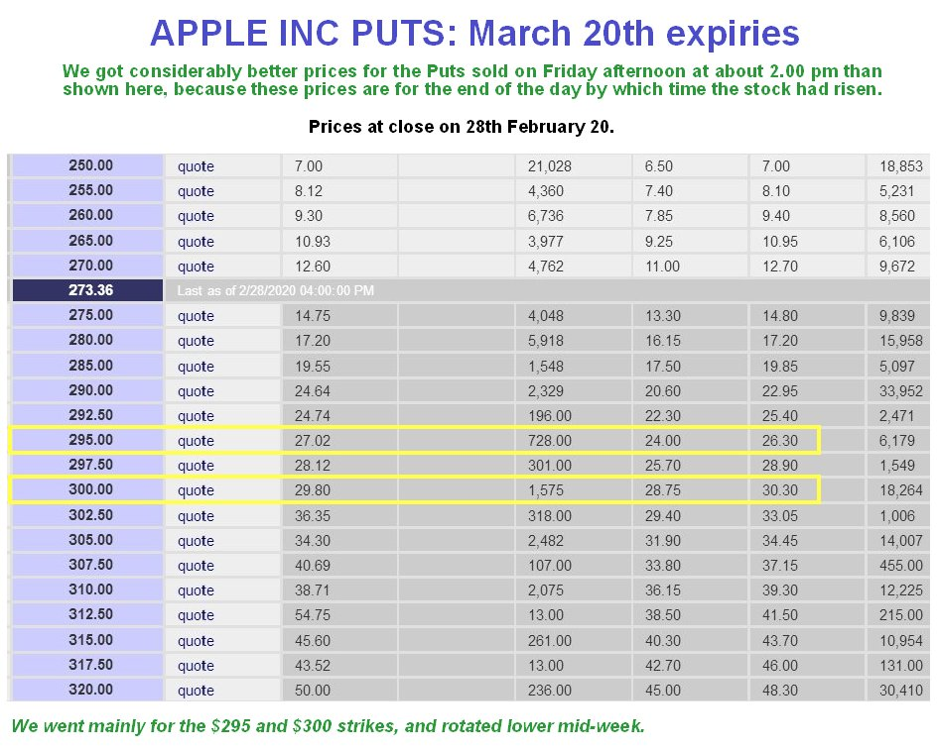
A 12 to 15-fold gain in a week is certainly something to be pleased about.
Now to look at Microsoft, which was a similar story, except that overall Microsoft looks somewhat more resilient than Apple, which is also evidenced by it putting in a bullish “piercing pattern” on Thursday and Friday, where Friday’s close is well into the “real body” of Thursday’s candle.
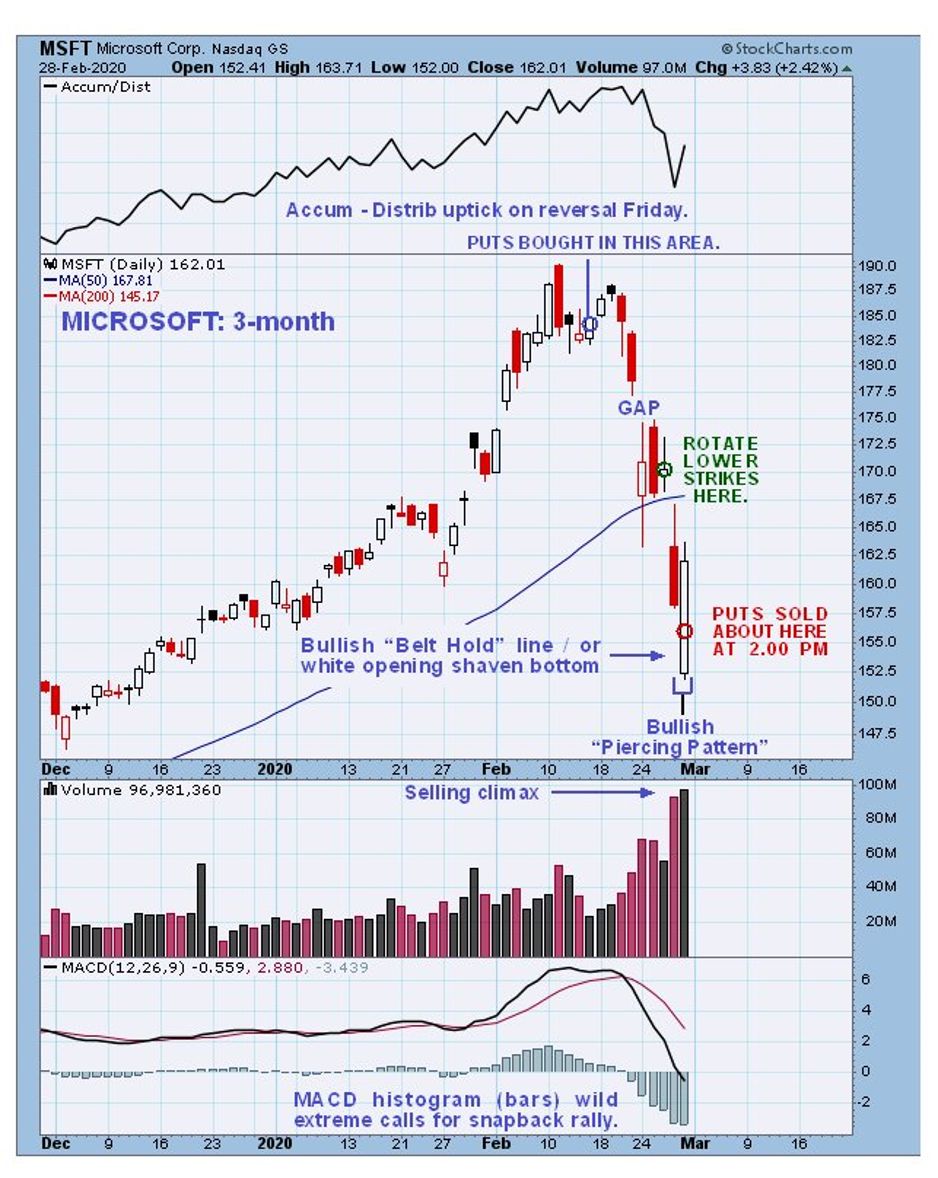
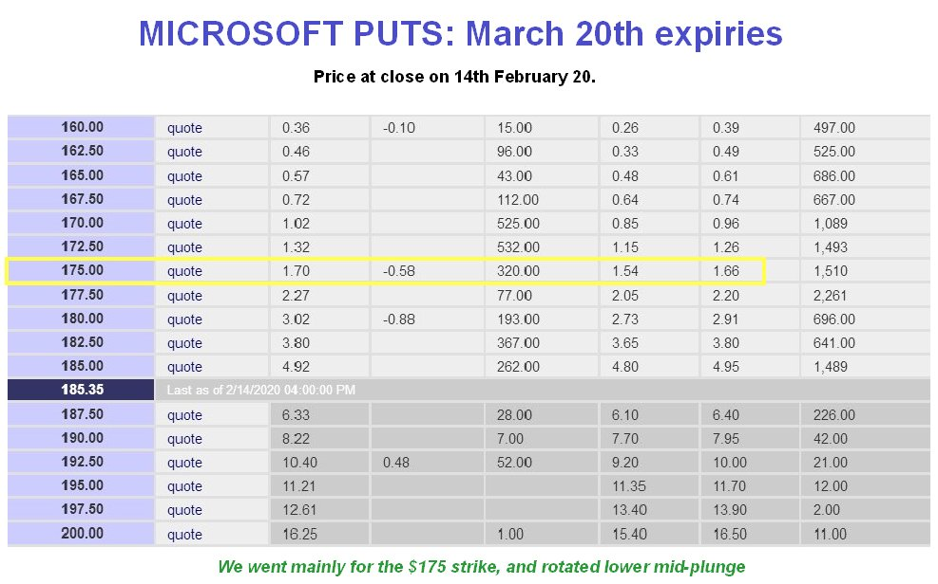
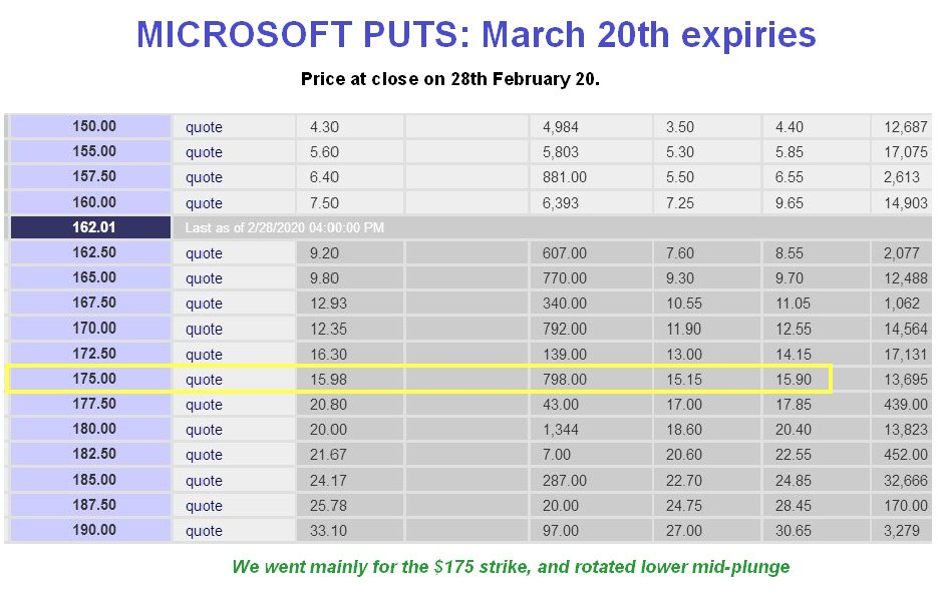
The Puts favored in Microsoft were again March 20th expiries, with a strike at $175, which had a more modest gain in comparison with Apple of about 10-fold, and again, because we sold mid-afternoon, we got better prices than those available at the close.
So we have every reason to feel pleased with ourselves over the outcome of these trades, and I would like to take this opportunity to congratulate those of you who had the courage to do these trades. As the British SAS say “Who dares, wins”.
As mentioned at the outset, this article is not mere gloating, for in the course of examining these charts we have discovered something useful – that the market has probably put in at least a short-term tradable bottom and should stage some sort of rally from here.
All Put tables courtesy of www.bigcharts.com
********


