Rich Dad Kiyosaki Says Trade "Fake Money" for Silver


Silver has cracked a key resistance level, and Rich Dad Poor Dad author Robert Kiyosaki called the white metal “the biggest bargain today.”
Silver was up 5.3 percent on Monday, the biggest gain in eight months. And on Wednesday, the white metal surged above $36 an ounce in early trading. The last time we saw $36 silver was in 2011, when it was on its way to a record high near $50 an ounce.
Over the last year, $35 has stood as a significant resistance level for silver. The Money Metals price chart below plots silver's nearly 100% move higher over the past three years.
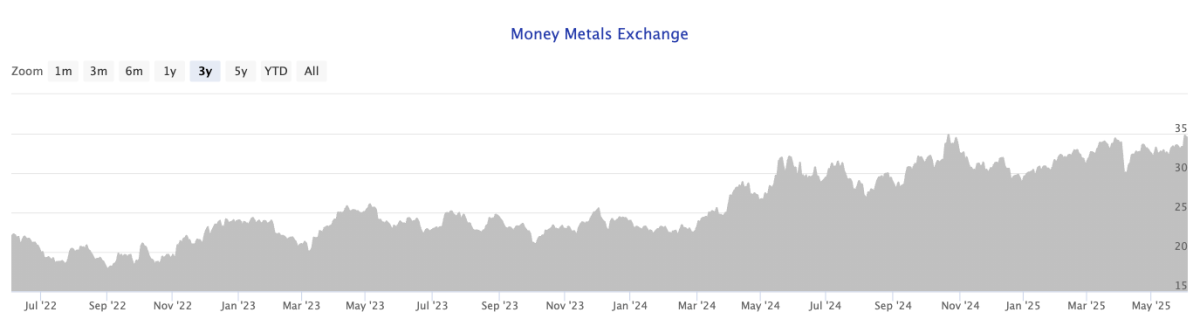
Having finally blown well past that barrier, there doesn’t appear to be much resistance on the way to new record highs.
We’ve also finally seen a narrowing of the gold-silver ratio to 94:1. It has been hovering around 100:1 for the last several months and rose to over 103:1 in April. This could signal the beginning of a rally that will bring silver closer to its historical relationship with gold. In modern times, the gold-silver ratio has averaged around 60:1.
In a post on X, Kiyosaki pointed out that silver is still significantly below its all-time high, even as gold has set multiple records over the last year. That means silver is on sale.
“Tomorrow I am going to my local gold and silver dealer and trading fake money for real silver…. no ETFs… the biggest bargain today.”
He also noted that at around $35 an ounce, “almost everyone anywhere in the world… has a chance to grow richer… while millions grow poorer.”
The technicals signal that silver is set up for a bull run.
If we look at a 50-year price chart for silver, we see a very distinctive pattern known as a “secular cup and handle.”
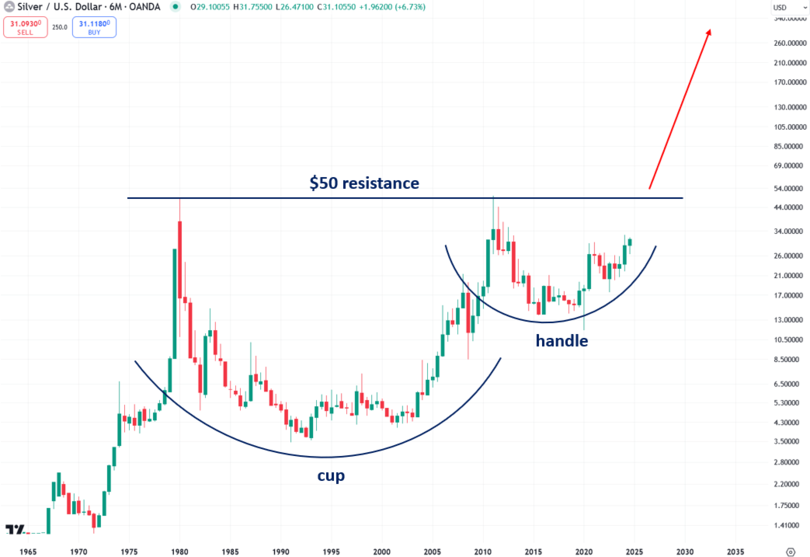
Money Metals CEO Stefan Gleason has long brought attention to this massive, long-term bullish pattern.
You can see the “cup” with the twin highs of around $50 per ounce in 1980 and 2011. Following the 2011 peak, we see a sharp decline in the price, followed by a consolidation “handle.”
A handle pattern on the chart of a stock or commodity often precedes a breakout.
This cup-and-handle pattern has played out over an extremely long timeframe. Historically, longer patterns portend bigger breakouts with a broader base signaling a bigger upside case.
Gold followed a similar long-term pattern, resolving with a breakout to new all-time highs beginning in 2023.
The supply and demand dynamics are also positive for silver.
Money Metals has recently reported that industrial demand for silver set a fourth consecutive record in 2024, driving a market deficit for the fourth consecutive year. Demand outstripped new supply by 148.9 million ounces. That drove the four-year market shortfall to 678 million ounces, the equivalent of 10 months of mining supply in 2024.
Given the dynamics, Kiyosaki asks a poignant question:
“What are you going to do tomorrow… grow richer or grow poorer? Please choose to get richer.”
********
More from Silver Phoenix 500


