Roadblocks To A Full-Fledged Bull Market


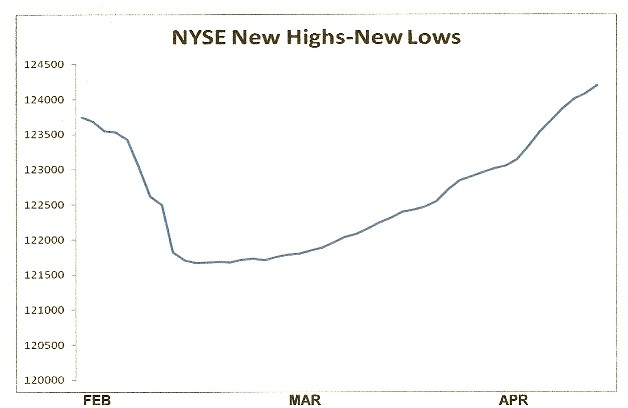
Since bottoming in February, the stock market “tape” has been very constructive. The NYSE advance-decline (A-D) line led the rally off the February lows, which is the first thing we look for when judging the strength of a bottom. Even more importantly, the cumulative NYSE new highs-new lows indicator continues to climb off its bottom of a few weeks ago and is advancing on a daily basis (below). Internal momentum, as reflected in the highs-lows, also remains positive.
It’s worth mentioning that as the major indices, led by the S&P500 (SPX), approach their 2015 highs, it will be important to watch for signs of internal weakness. This was the main problem throughout 2015, as the new 52-week lows would increase each time the major indices rallied toward the all-time highs. That hasn’t happened this time around, which is an encouraging sign. It doesn’t mean the market is free and clear of potential pitfalls, however.
Let’s take a look at some of the roadblocks to a resumption of the longer-term bull market. While most indicators are currently positive, there are three potential threats to the re-emerging bull market in stocks: the broad commodity market (notably crude oil), the financial sector, and China stocks.
On the financial front, the PHLX Bank Index (BKX) closed under its technically important 15-day moving average last month and remains under it as of this writing. Bank stocks don’t have as much downside leeway as other industry groups right now since the banks, by and large, haven’t seen as extensive a rally as other market groups. A failure to quickly recover above the 15-day MA could invite another bear raid on the banks.
The main potential roadblock standing in the way of new all-time highs this spring is the beleaguered commodity market. The following graph of the Commodity Research Bureau Index (CRB) is dangerously close to its multi-year low. If the index breaks under the February chart support the resulting stop-loss run could lead to further weakness which spills over into the broad equity market, much as it did last year.
The primary culprit here is the crude oil price, which is also threatening to test its January-February pivotal low. A breakdown below this chart benchmark would cause a sympathy move lower in the oil/gas stocks. The energy sector stocks were the main source of the internal weakness in 2015 and early 2016.
If by contrast oil can establish support above the January-February low, it could instead serve as a confirmation for traders that a major bottom is in for crude oil. This more than anything else would buoy investor confidence that the threat of a global economic crisis, insofar as it pertains to the U.S., has diminished.
A final consideration is China. In many ways, China is the X-factor in the global crisis and will likely determine whether or not it’s over or whether we’re merely seeing a temporary respite in an ongoing crisis. A breakdown to the January-February double-bottom lows in the China stocks would most likely have a negative impact on the U.S. equity market, much as it did in 2015. By contrast, the recent breakout above the 3,000 trading range ceiling in the Shanghai Composite Index (below) is encouraging. If the Shanghai Composite can build on this by establishing support above this benchmark level, it could easily pave the way for another leg higher for U.S. and global equities.
Much depends on the China equity market near-term outlook. I consider the Shanghai Composite Index to be one of the most important indicators traders should be watching right now.
Most importantly, though, is the overall technical condition of the NYSE broad market. While the major indices have been sluggish lately, the tape continues to reflect internal strength. The new 52-week highs are still over 100 daily while the new lows have been well under 40 on a daily basis. The market’s internally healthy state can be seen in the NYSE directional indicator, which is based on the new 52-week highs-lows. As emphasized in previous reports, as long as this indicator is still rising the near-term path of least resistance for stocks is still up.
In the coming weeks, the bulls will have a chance to prove the bear market is over. In order for this to be confirmed, the major indices should test their November 2015 resistance levels without a corresponding increase in the number of stocks making new 52-week lows. The market failed this simple test numerous times last year.
Also, if the commodity market continues to weaken, we’ll need assurance that it won't spill over into the equity market like it did last year. This will also be confirmed as long as the new 52-week NYSE lows remain below 40 on a daily basis while the new highs substantially outnumber new lows. The period between now and early May will likely provide us with the results of both tests.
Mastering Moving Averages
The moving average is one of the most versatile of all trading tools and should be a part of every investor’s arsenal. Far more than a simple trend line, it’s also a dynamic momentum indicator as well as a means of identifying support and resistance across variable time frames. It can also be used in place of an overbought/oversold oscillator when used in relationship to the price of the stock or ETF you’re trading in.
In my latest book, Mastering Moving Averages, I remove the mystique behind stock and ETF trading and reveal a simple and reliable system that allows retail traders to profit from both up and down moves in the market. The trading techniques discussed in the book have been carefully calibrated to match today’s fast-moving and sometimes volatile market environment. If you’re interested in moving average trading techniques, you’ll want to read this book.
Order today and receive an autographed copy along with a copy of the book, The Best Strategies for Momentum Traders. Your order also includes a FREE 1-month trial subscription to the Momentum Strategies Report newsletter:
http://www.clifdroke.com/books/masteringma.html
Clif Droke is a recognized authority on moving averages and internal momentum. He is the editor of the Momentum Strategies Report newsletter, published since 1997. He has also authored numerous books covering the fields of economics and financial market analysis. His latest book is Mastering Moving Averages. For more information visit www.clifdroke.com
More from Silver Phoenix 500


