RSI Versus TRIX


US Dollar Aimless Drift Chart
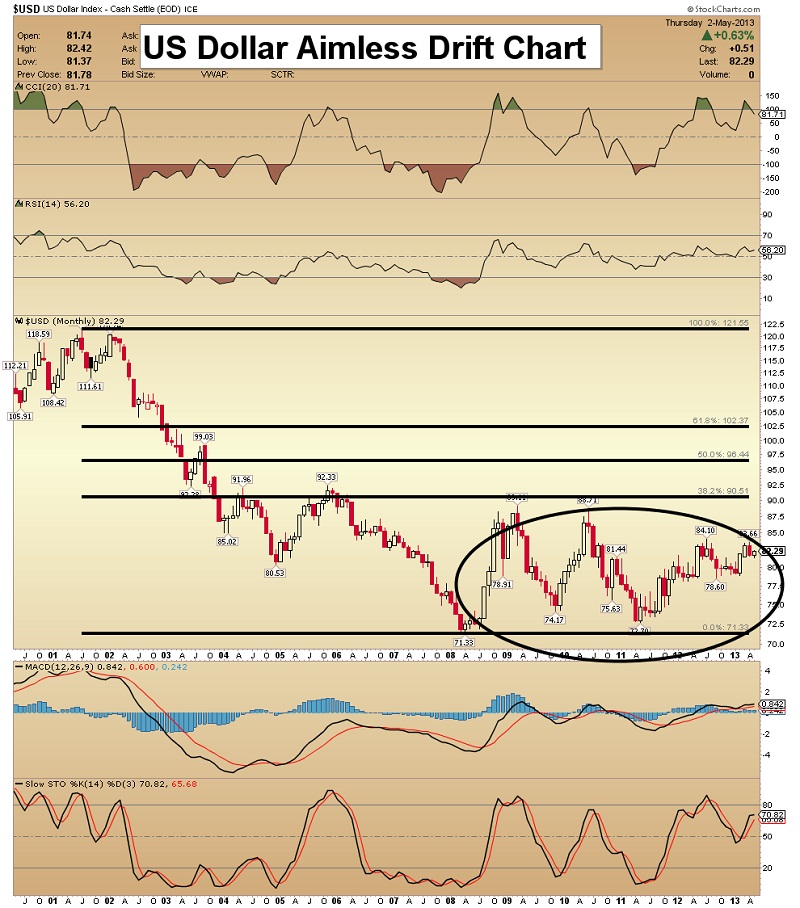
• The "go away in May" season in the stock market has arrived, and that could support the dollar if stocks weaken, as I suspect they will.
• In the short term, look for resistance at the 84 area, and major resistance just under 90.
• The US economy would have to undergo a major readjustment if QE ceased. Quantitative easing could even be replaced with outright money printing. One prominent hedge fund manager is already calling for it!
• Regardless of day to day moves in the dollar, the US currency has to decline in the long term. The long term dollar chart looks terrible.
Gold RSI Versus TRIX Chart
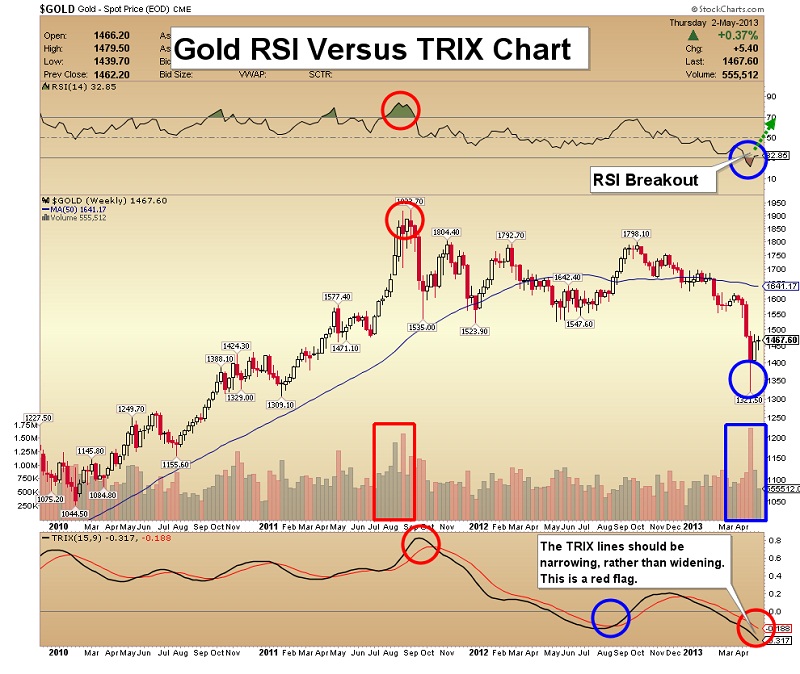
• To fuel higher gold prices, strong upside volume is required, and it’s not here, at least not yet.
• The long term TRIX indicator has not turned up, which is somewhat concerning.
• The good news is that there is an RSI upside breakout in play.
Gold $1503 Chart
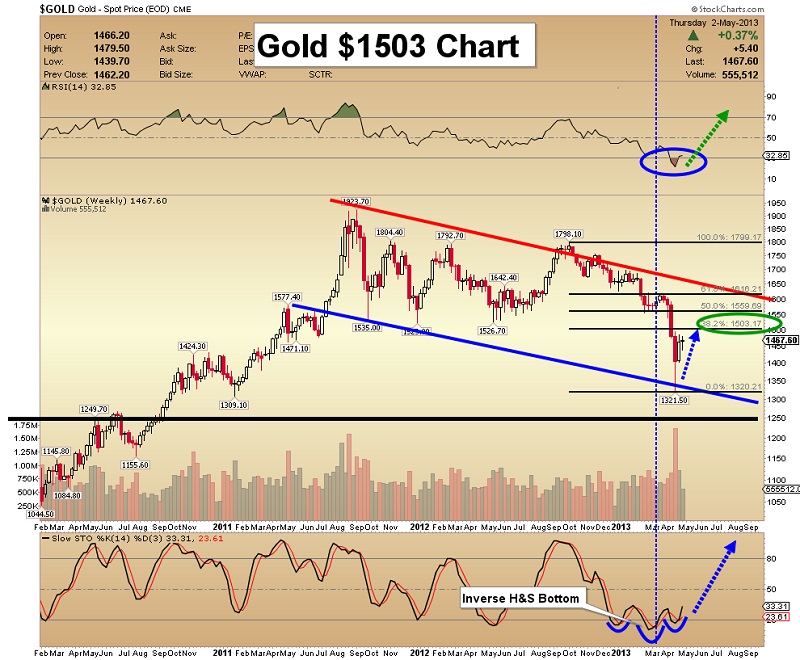
• Fibonacci analysis shows some logical points of resistance for gold. It would be quite ominous, technically, if this rally falters before at least reaching the 38% retracement area, which is about $1503.
• Note the slow Stokes indicator, at the bottom of the chart. There’s an inverse head & shoulders bottom pattern there, which is quite rare, and very bullish.
• Gold is likely to rise to that first “Fib” retracement line, in the $1503 area, but there could be a fairly hard-sell off that follows.
• It’s critical to stay focused on the trading volume over the next few weeks. Volume must start picking up, for the rally to continue.
Gold Stocks (GDX) Versus Gold Bullion Chart
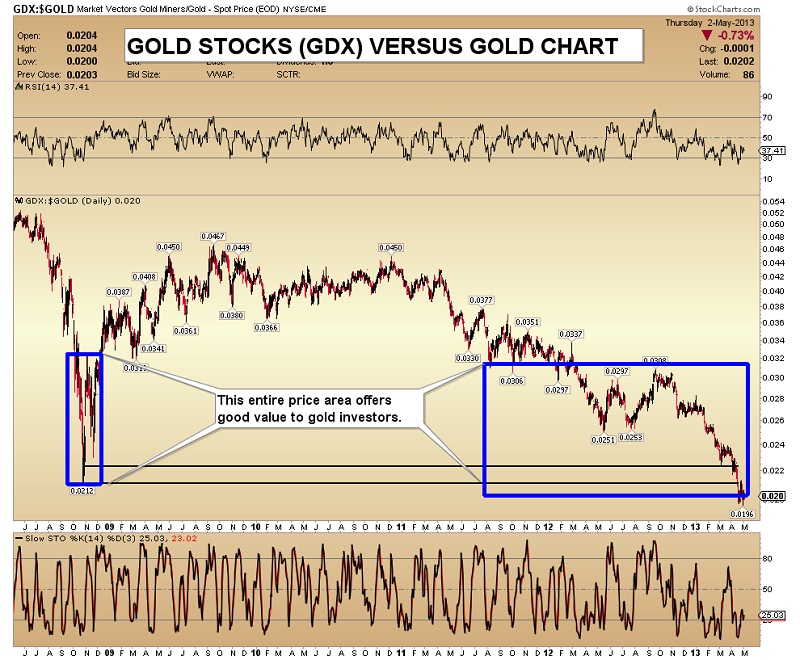
• The best way to measure the value of gold stocks is to compare them to gold itself. Gold stocks offer more relative value to investors now, than at the 2008 lows.
• Great values, unfortunately, can become “greater values”. Some technicians would argue that this chart shows a downside breakout, rather than a “bargain”.
• In a situation like this, where some mining companies are running out of money and earnings are falling, I suggest using a hedging vehicle like DUST-nyse. That can help buffer the drawdowns that occur when accumulating quality gold stocks.
GDX Fibonacci Chart
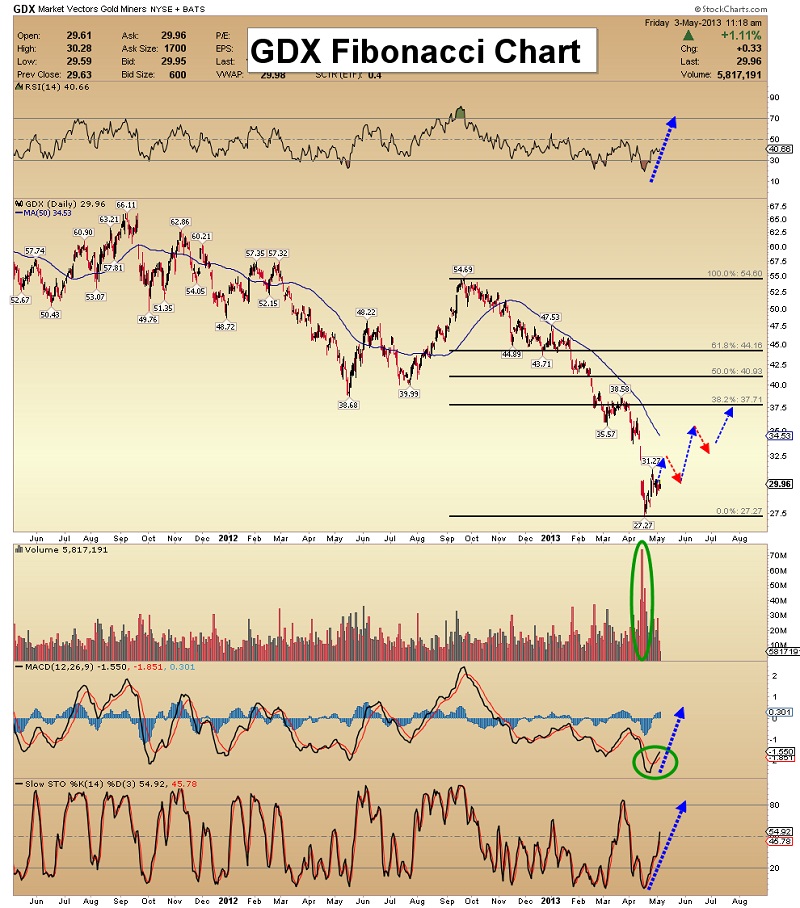
• My immediate price target for GDX is the gap at about $32.
• After that, GDX could rise to $37.71, which is the first Fibonacci retracement line, measured from the high at $54.69.
GDXJ Backtest Chart
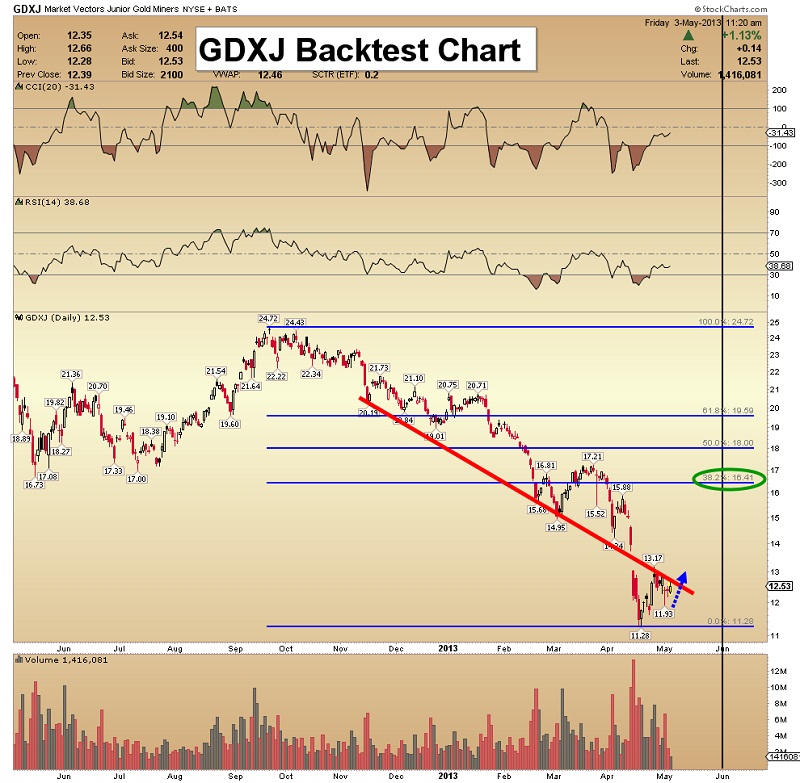
• I’m waiting for the “GDXJ dust” to clear. Technically, the prospects of GDXJ making a move as high as $16.41 or slightly higher, are fairly good.
• Note the recent high at $13.17. Traders should be sellers between $13 and $14.
• If GDXJ can trade above the red trend line, it would probably mean that a rally towards $16.41 is underway.
Silver Backtest Chart
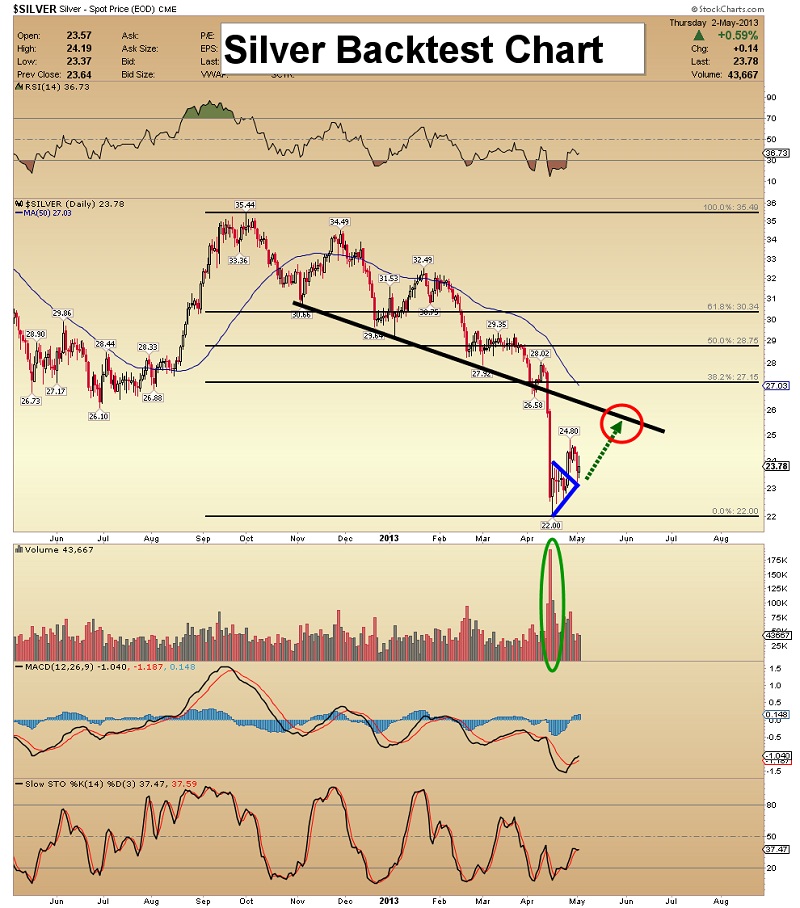
• I advocate buying silver on a regular basis, but in this type of market the $19 “door” for silver could still be open. Be prepared to use it as an opportunity.
• Note the blue triangle pattern, and the nice pullback to the apex. Silver’s price action is bullish, and I have a $26 target in the short term.
• As with gold, it is critical that silver’s trading volume begins to pick up. If gold doesn’t sell off too hard from the $1500 area, silver could soon acquire the first Fibonacci retracement line target, at $27.15.
![]()
Unique Introduction For Gold-Eagle Readers: Send me an email to alerts@superforcesignals.com and I'll send you 3 of my next Super Force Surge Signals, as I send them to paid subscribers, to you for free. Thank-you!
Stay alert for our Super Force alerts, sent by email to subscribers, for both the daily charts on Super Force Signals at www.superforcesignals.com and for the 60 minute charts at www.superforce60.com
About Super Force Signals:
Our Super Force signals are created thru our proprietary blend of the highest quality technical analysis and many years of successful business building. We are two business owners with excellent synergy. We understand risk and reward. Our subscribers are generally successful business owners, people like yourself with speculative funds, looking for serious management of your risk and reward in the market.Frank Johnson: Executive Editor, Macro Risk Manager.
Morris Hubbartt: Chief Market Analyst, Trading Risk Specialist.
More from Silver Phoenix 500


