Silver’s Breakdown, Miners Reversal And Profits – Lots Of Profits


Wow, what a move we just saw in silver… Without further ado, let’s dive into the chart.
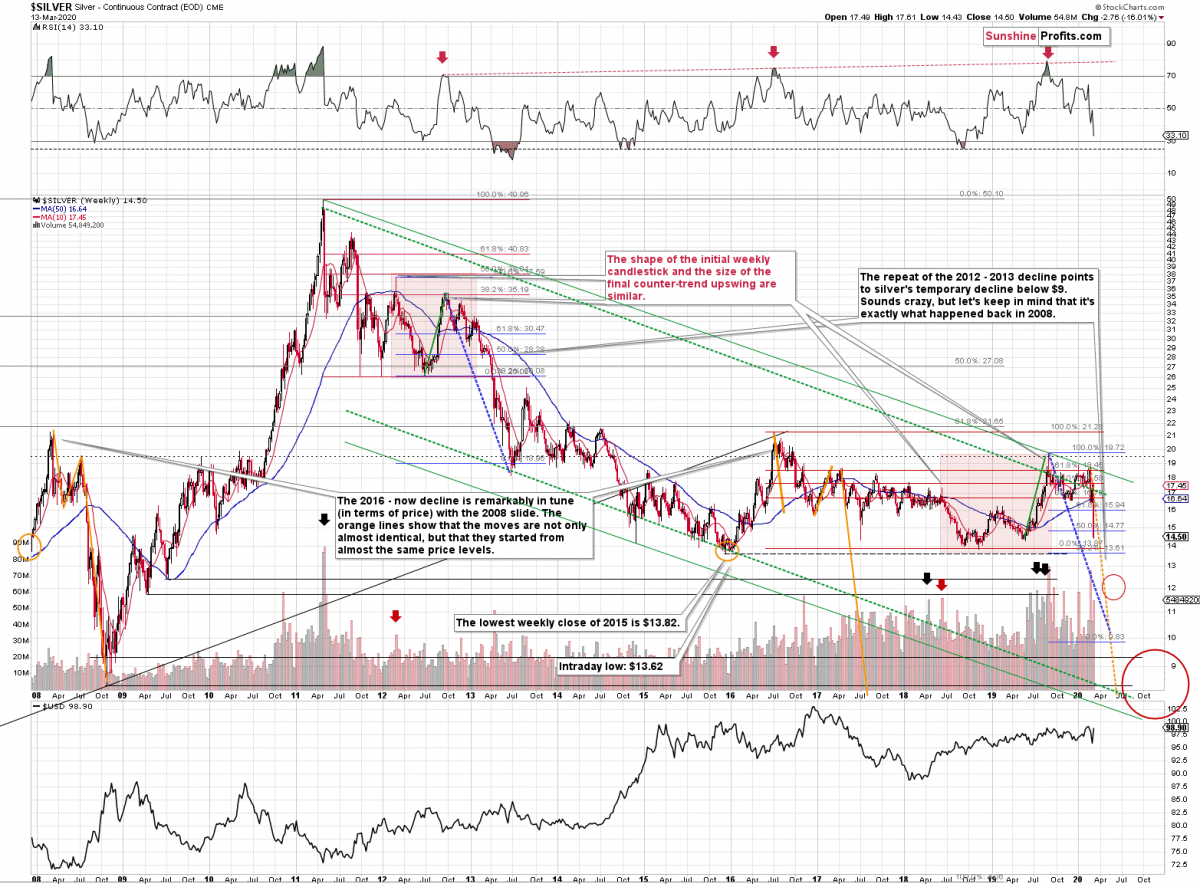
Silver just plunged to our initial target level and reversed shortly after doing so. It was for many months that we’ve been featuring the above silver chart along with the analogy to the 2008 slide. People were laughing at us when we told them that silver was likely to slide below $10.
Well, today’s low of $11.80 proves that we were not out of our minds after all. Our initial target was reached, and as we had explained earlier today, the entire panic-driven plunge has only begun.
Those who were laughing the loudest will prefer not to notice that silver reversed its course at a very similar price level at which it had reversed initially in 2008. It was $12.40 back then, but silver started the decline from about 50 cent higher level, so these moves are very similar.
This means that the key analogy in silver (in addition to the situation being similar to mid-90s) remains intact.
It also means that silver is very likely to decline AT LEAST to $9. At this point we can’t rule out a scenario in which silver drops even to its all-time lows around $4-$5.
Crazy, right? Well, silver was trading at about $19 less than a month ago. These are crazy times, and crazy prices might be quite realistic after all. The worst is yet to come.
Let’s quote what the 2008-now analogy is all about in case of silver.
There is no meaningful link in case of time, or shape of the price moves, but if we consider the starting and ending points of the price moves that we saw in both cases, the link becomes obvious and very important. And as we explained in the opening part of today's analysis, price patterns tend to repeat themselves to a considerable extent. Sometimes directly, and sometimes proportionately.
The rallies that led to the 2008 and 2016 tops started at about $14 and we marked them both with orange ellipses. Then both rallies ended at about $21. Then they both declined to about $16. Then they both rallied by about $3. The 2008 top was a bit higher as it started from a bit higher level. And it was from these tops (the mid-2008 top and the early 2017 top) that silver started its final decline.
In 2008, silver kept on declining until it moved below $9. Right now, silver's medium-term downtrend is still underway. If it's not clear that silver remains in a downtrend, please note that the bottoms that are analogous to bottoms that gold recently reached, are the ones from late 2011 - at about $27. Silver topped close to $20.
The white metal hasn't completed the decline below $9 yet, and at the same time it didn't move above $19 - $21, which would invalidate the analogy. This means that the decline below $10, perhaps even below $9 is still underway.
Naturally, the implications for the following months are bearish.
Let's consider one more similarity in the case of silver. The 2012 and the 2018 - today performance are relatively similar, and we marked them with red rectangles. They both started with a clear reversal and a steady decline. Then silver bottomed in a multi-bottom fashion, and rallied. This time, silver moved above its initial high, but the size of the rally that took it to the local top (green line) was practically identical as the one that we saw in the second half of 2012.
The decline that silver started in late 2012 was the biggest decline in many years, but in its early part it was not clear that it's a decline at all. Similarly to what we see now, silver moved back and forth with lower highs and lower lows, but people were quite optimistic overall, especially that they had previously seen silver at much higher prices (at about $50 and at about $20, respectively).
Also, if you didn’t profit on the recent decline in silver, don’t despair – this decline seems to be far from over and there will be plenty of room for profits, especially that silver seems to be starting a corrective upswing now. Just like it did in the 2008. Back then, it corrected to about $14 before moving lower and this might be a realistic target also this time. This would serve as a verification of the breakdown below the 2015 low, and it would open the way for even lower silver prices.
Meanwhile, silver's relationship with gold continues to support medium-term downtrend in the precious metals sector.
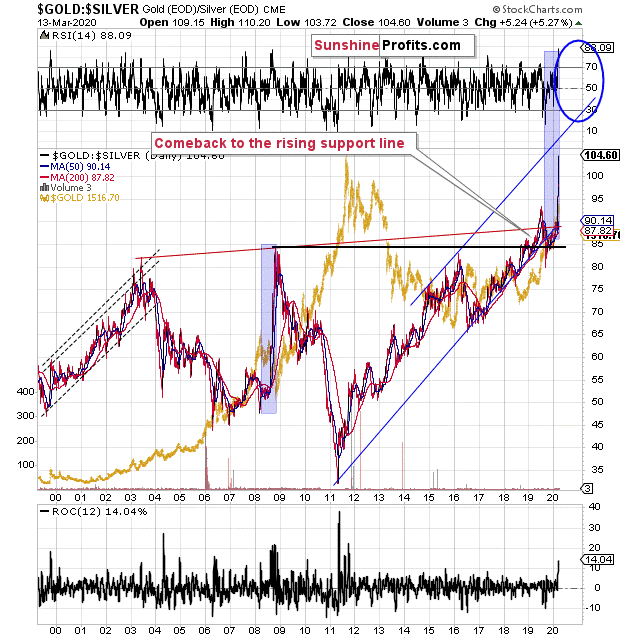
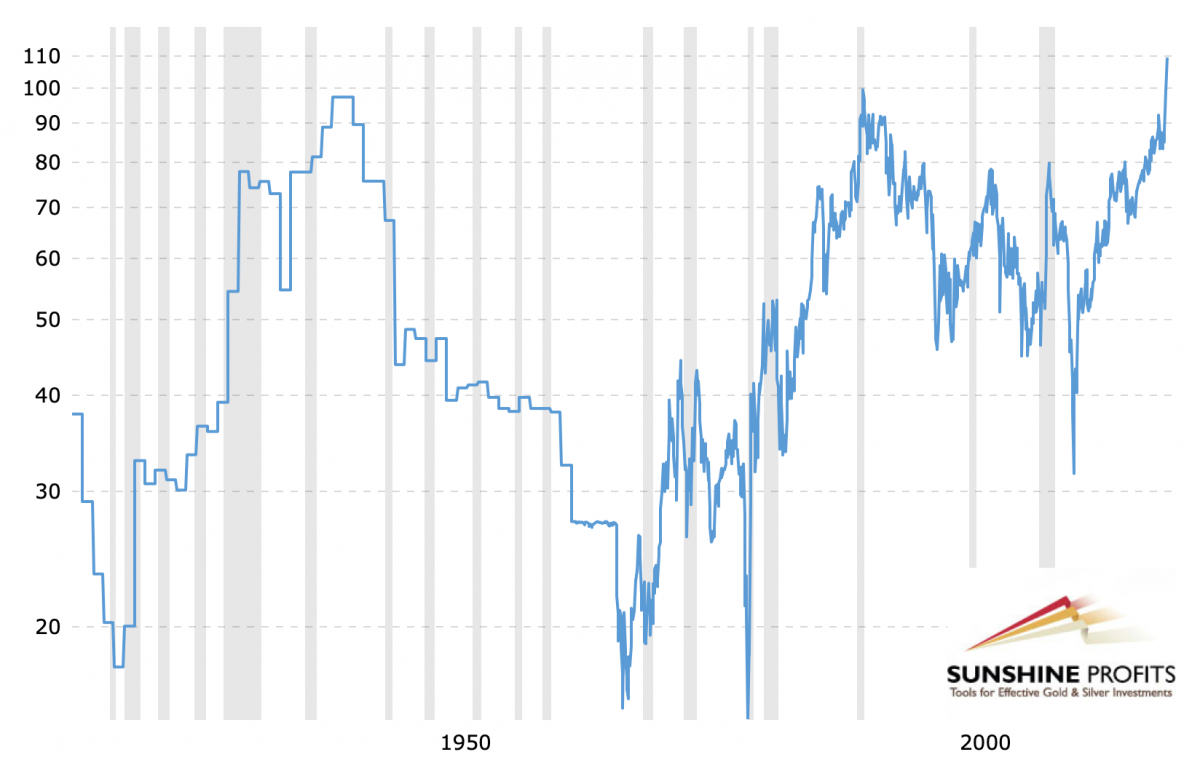
Remember the time, when the gold to silver ratio moved to 80 and practically everyone (well, we didn’t) told you to buy silver? We told you that the real long-term resistance was at the 100 level, and that the gold to silver ratio broke above the previous highs, it was likely to shoot up. That’s exactly what happened.
Last week we wrote about the move to the 100 level in the following way:
We've been writing the above for weeks, despite numerous calls for a lower gold to silver ratio. And our target of 100 was just hit today. It was only hit on an intraday basis, not in terms of the daily closing prices, but it's still notable.
We had been expecting the gold to silver ratio to hit this extreme close or at the very bottom and the end of the medium-term decline in the precious metals sector - similarly to what happened in 2008. Obviously, that's not what happened.
Instead, the ratio moved to 100 in the situation where gold rallied, likely based on its safe-haven status, and silver plunged based on its industrial uses.
Despite numerous similarities to 2008, the ratio didn't rally as much as it did back then. If the decline in the PMs is just starting - and that does appear to be the case - then the very strong long-term resistance of 100 might not be able to trigger a rebound.
It might also be the case that for some time gold declines faster than silver, which would make the ratio move back down from the 100 level. The 100 level could then be re-tested at the final bottom.
Or... which seems more realistic, silver and mining stocks could slide to the level that we originally expected them to while gold ultimately bottoms higher than at $890. Perhaps even higher than $1,000. With gold at $1,100 or so, and silver at about $9, the gold to silver ratio would be a bit over 120.
If the rally in the gold to silver ratio is similar to the one that we saw in 2008, the 118 level or so could really be in the cards. This means that the combination of the above-mentioned price levels would not be out of the question.
At this time it's too early to say what combination of price levels will be seen at the final bottom, but we can say that the way gold reacted recently and how it relates to everything else in the world, makes gold likely to decline in the following months. Silver is likely to fall as well and its unlikely that a local top in the gold to silver ratio will prevent further declines.
Indeed, gold to silver ratio didn’t stop the decline and it’s unlikely to stop it anytime soon. The reason is that the ratio broke above the 100 level and today, it soared above it even more. At the moment of writing these words, the gold to silver ratio is trading at about 120.
Breakout above the resistance level as extremely important is very likely to be followed by at least a pullback. A comeback to this level (100) and then another move up seems to be the most likely outcome.
This means that silver would be likely to recover – and it would be likely to recover more than gold.
Thank you for reading the above free analysis. It’s part of today’s timely Gold & Silver Trading Alert. We encourage you to sign up for our free gold newsletter – as soon as you do, you'll get 7 days of free access to our premium daily Gold & Silver Trading Alerts and you can read the full version of the above analysis right away. Sign up for our free gold newsletter today!
Przemyslaw Radomski, CFA
Editor-in-chief, Gold & Silver Fund Manager
Sunshine Profits - Effective Investments through Diligence and Care
* * * * *
All essays, research and information found above represent analyses and opinions of Przemyslaw Radomski, CFA and Sunshine Profits' associates only. As such, it may prove wrong and be subject to change without notice. Opinions and analyses were based on data available to authors of respective essays at the time of writing. Although the information provided above is based on careful research and sources that are believed to be accurate, Przemyslaw Radomski, CFA and his associates do not guarantee the accuracy or thoroughness of the data or information reported. The opinions published above are neither an offer nor a recommendation to purchase or sell any securities. Mr. Radomski is not a Registered Securities Advisor. By reading Przemyslaw Radomski's, CFA reports you fully agree that he will not be held responsible or liable for any decisions you make regarding any information provided in these reports. Investing, trading and speculation in any financial markets may involve high risk of loss. Przemyslaw Radomski, CFA, Sunshine Profits' employees and affiliates as well as members of their families may have a short or long position in any securities, including those mentioned in any of the reports or essays, and may make additional purchases and/or sales of those securities without notice.
********
 Przemyslaw Radomski, CFA, is the founder, owner and the main editor of SunshineProfits.com.
More from Silver Phoenix 500


