Silver’s Q4 Seasonal Outlook


What has been will be again,
what has been done will be done again;
there is nothing new under the sun.
Ecclesiastes 1.9
History repeats itself. Not always, and not 100%, but often enough and to an extent that’s significant enough to make these repetitions potentially profitable. In order to take advantage of this tendency, we created a tool called True Seasonals (and we are now providing it free of charge). If you heard about seasonality, you already know what to expect, but you may not know what you have been missing. Many things take place at the same time each year (for instance people making a lot of jokes on April Fools’ Day), but quite a few of them take place only more or less regularly.
What’s the exact date for Thanksgiving in 2023? You probably had to check as it’s not the same date every year. In trading, there are also things that tend to happen regularly (like rallies in January), but there are also things that happen only more or less regularly that also impact prices – for instance the expiration of gold and silver options. Simple Seasonality charts only take into account what’s happening regularly, and they do not directly include the impact of the expiration dates of derivatives. We added this effect to regular seasonality, creating the True Seasonal charts.
We also checked how similar the patterns are in each of the recent years and based on that we created the Accuracy metric. If similar things happened at a given time of the year over the years, this pushes Accuracy higher. In such a case, it seems more likely that these similar things would also be repeated this year.
Making Seasonality a Tool in Your Arsenal
In our weekly seasonal reports, we will be giving you a heads up on what the True Seasonal charts are currently suggesting for several markets.
Seasonality, though, is just one technique, just one tool – and not a complete analysis of a given market. While an insightful measure on its own, and robust in the way we calculate its data for you, it’s not a Holy Grail in itself. It can be one of the great and versatile tools in your armory – it has many applications such as additional guidance in reading the market context, a helpful tool in timing and estimating corrections before they happen, an extra basis for your reversion to the mean strategies, a profitable filter for many a trading system you’re using currently, or a valuable addition to your options trading strategies (be they directional or not). Imagination is the limit.
Please think about seasonality as you would approach e.g. the RSI, Stochastics or any other indicator – these are useful on their own, but more things should be taken into account before making investment decisions. For more details, you may want to read our seasonality report
Please do tell us how you like this Seasonality Weekly Report. How can we make the following ones even better for your needs? Feedback is welcome and appreciated – drop us an email.
Having said that, let’s move to the analysis itself. In today’s issue, we discuss what’s in store for the price of silver.
Silver Seasonality
Let’s take a look at the first chart. It is our proprietary Silver True Seasonality where we combined the regular seasonality with the effect of the expiration of options and accuracy estimation. The yearly seasonal pattern of the price of silver was calculated using a 17-year-long period from 2002 to 2018 and then adjusted for the expiration of options that we observed between 2009 and 2018.
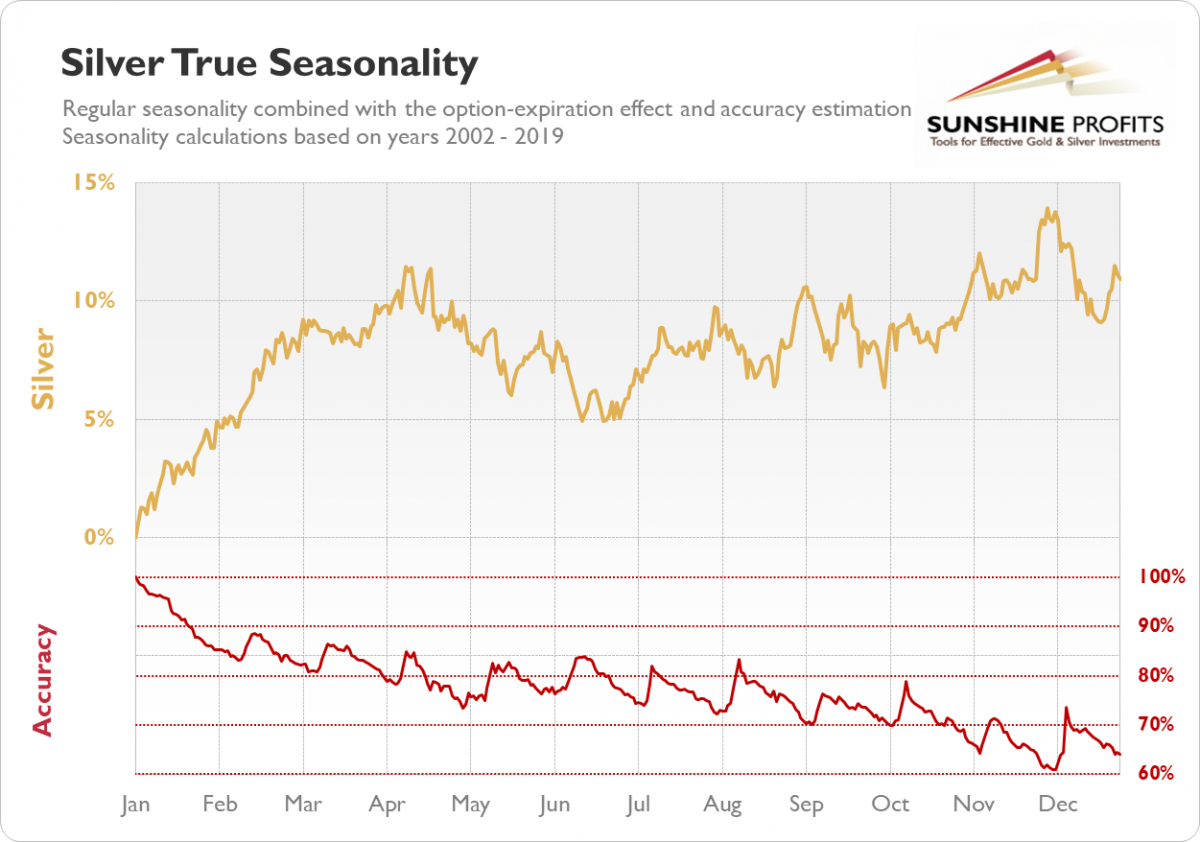
We can see that the market has a tendency to go down in April and persist in such a move until June. That pattern worked quite well from April up to the late May this year. Then the price of silver rallied and in July it broke above its early-2019 highs. While the rally came early compared to the usual seasonal pattern, seasonality still would have been a pretty good guide through the April-May period.
So, the market went into “rally mode” a little bit early compared with its usual seasonal activity in the Spring. Again, this is the part we have mentioned before – no pattern is perfect, and history does not copy itself to a T.
With the increased volatility in silver, it is particularly interesting to see what the seasonal analysis would have suggested for the white metal near the turning point which came in late August/early September as the price was hitting very significant highs, even ones above the 2017 highs. To figure this out, we could not only look at the indications for the price but also at the Accuracy indicator.
Let’s take a look at the quarterly seasonal pattern of the price of silver for the third quarter. It gives us a more detailed seasonality pattern picture, along with the Accuracy.

The chart shows us that the market tends to rise quite significantly at the end of August but breaks down almost as significantly in the first week of September. This is precisely the time frame that would interest us for the purpose determining a possible move in August. Most importantly, it suggests that a major breakdown can transpire at the beginning of September. The analogy might not be perfect, but still, if you are witnessing a rise in the price of silver, you might be interested in the fact that the move could break down in the next week. And even if the actual move is off by a couple of days, this could still be very valuable information. One more thing we would like to discuss is the rise in the Accuracy metric following the breakdown. It suggests that a move down is even more likely than if the indication was only based on average prices.
Let’s take a look at the real price of silver (daily chart courtesy of http://stockcharts.com):
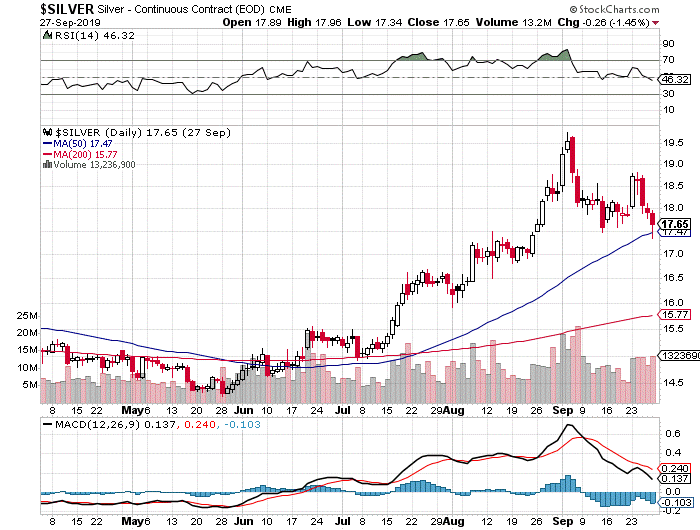
The market corrected in line with the indications of the True Seasonal charts. OK, this is all great but what is the possible indication for the next important move? To answer that, we have to revert to the seasonal chart for Q4.
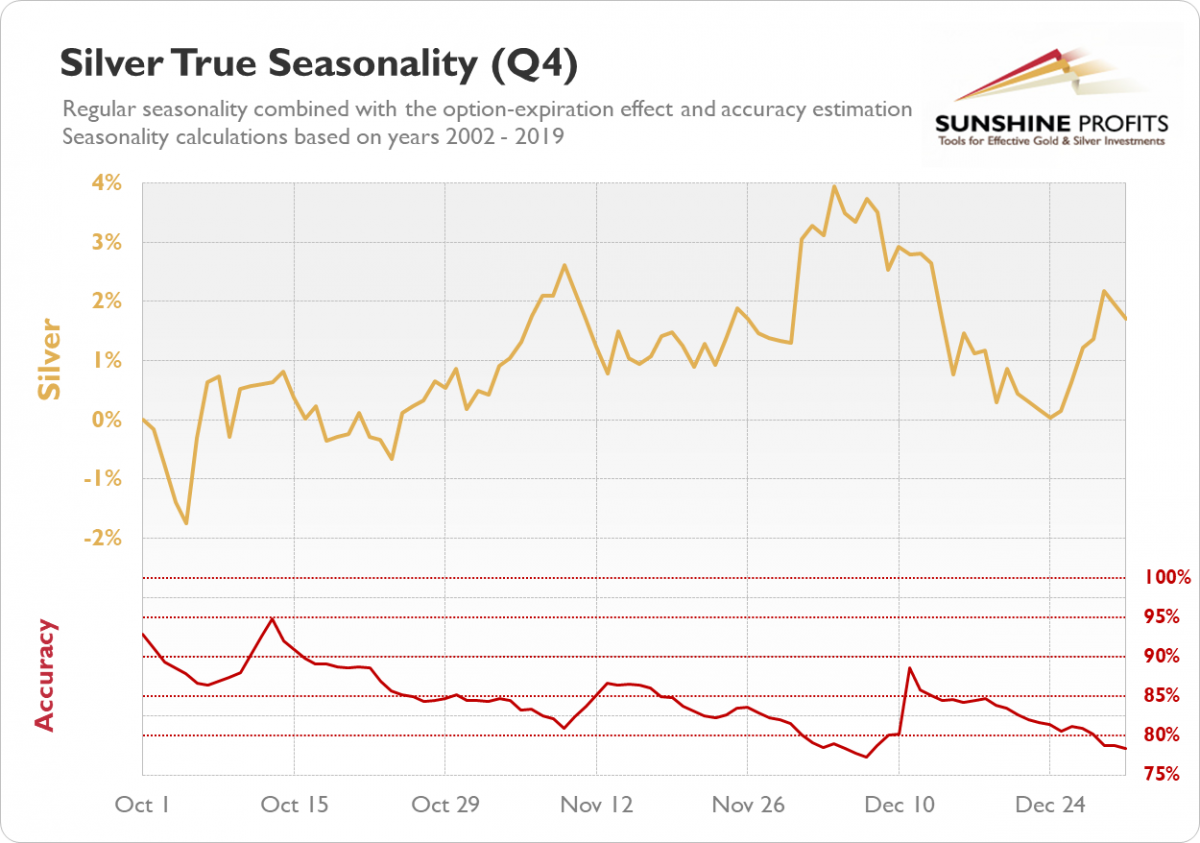
And there you have it. The first significant move suggested by the Q4 silver seasonal chart is quite a significant drop in the price of the white metal. The default position to interpret True Seasonals is to see what the indications are and compare them with other factors. Fortunately, the immediately bearish indications for silver are reinforced by other factors discussed in our Gold & Silver Trading Alerts.
This concludes our first analysis of current seasonal charts. We hope this helps you navigate the market and gain the necessary tools to become successful in this space.
We hope you have enjoyed this week’s discussion of True Seasonal trading and we invite you to experiment and make these tendencies work for you – our Seasonality charts are freely available right on our website.
We encourage you to sign up for our daily newsletter, too - it's free and if you don't like it, you can unsubscribe with just 2 clicks. If you sign up today, you'll also get 7 days of free access to our premium daily Gold & Silver Trading Alerts. On top of that, you’ll also get 7 days of instant email notifications the moment a new Signal is posted, bringing our Day Trading Signals to your fingertips. Sign up for the free newsletter today!
Mike McAra
Bitcoin Trading Strategist
Sunshine Profits - Effective Investments through Diligence and Care
Disclaimer: Please note that the aim of the above analysis is to discuss the impact of seasonality on the underlying asset’s price alone. This analysis does not indicate (nor does it aim to do so) whether gold, silver, or mining stocks are likely to move higher or lower in the short- or medium term. In order to determine the latter, many additional factors need to be considered (e.g. sentiment, chart patterns, cycles, indicators, ratios, self-similar patterns and more) and we are taking them into account (and discussing the short- and medium-term outlook) in our Gold & Silver Trading Alerts.
* * * * *
All essays, research and information found above represent analyses and opinions of Przemyslaw Radomski, CFA and Sunshine Profits' associates only. As such, it may prove wrong and be a subject to change without notice. Opinions and analyses were based on data available to authors of respective essays at the time of writing. Although the information provided above is based on careful research and sources that are believed to be accurate, Przemyslaw Radomski, CFA and his associates do not guarantee the accuracy or thoroughness of the data or information reported. The opinions published above are neither an offer nor a recommendation to purchase or sell any securities. Mr. Radomski is not a Registered Securities Advisor. By reading Przemyslaw Radomski's, CFA reports you fully agree that he will not be held responsible or liable for any decisions you make regarding any information provided in these reports. Investing, trading and speculation in any financial markets may involve high risk of loss. Przemyslaw Radomski, CFA, Sunshine Profits' employees and affiliates as well as members of their families may have a short or long position in any securities, including those mentioned in any of the reports or essays, and may make additional purchases and/or sales of those securities without notice.
********
More from Silver Phoenix 500


