Silver’s Time to Shine


Like gold, we can study the supply-demand picture for silver to get a sense of whether we’ve reached peak mine supply.
At AOTH we differentiate between the total silver supply, which lumps in recycled silver with mined silver, versus mine supply on its own.
According to the 2024 World Silver Survey, in 2023 global mine fell by 1% year on year to 830.5 million ounces. Output was significantly affected by the four-month suspension of operations at Newmont’s Peñasquito in Mexico following strike action. This was compounded by a drop in production from Argentina due to the processing of lower ore grades at some mines and the closure of Pan American Silver’s Manantial Espejo mine.
Silver recycling rose for a fourth consecutive year, up 1% in 2023 to a 10-year high of 178.6Moz.
Combined, therefore, we have total silver supply reaching 1,010.7Moz (or 1.010 billion ounces) in 2023.
How about demand? According to the World Silver Survey, after a record 2022, global silver demand fell by 7% last year to 1,195Moz, still 9% up on the next-highest total.
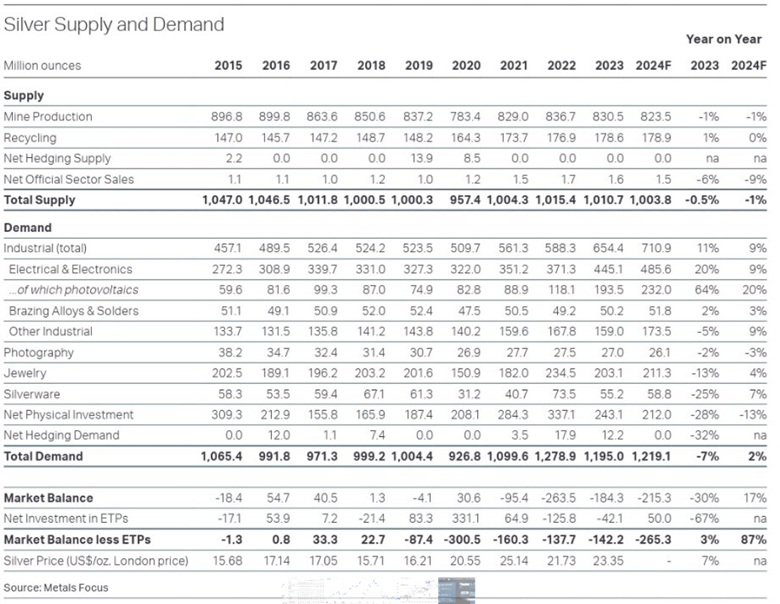
2023 demand of 1.195 billion ounces outstripped supply of 1.010 billion ounces by 185Moz. But remember, recycling is included in the total supply. When we take recycling out, 178.6Moz, we get an even greater deficit of 363.6Moz.
This is significant, because it’s saying mined silver supply last year of 1.010 billion ounces was unable to meet total demand, industrial plus investment, of 1.195 billion ounces. It fell short by 185Moz, and that was including recycling.
This is our definition of peak mined silver. Will the silver mining industry be able to produce, or discover, enough silver that it’s able to meet demand without having to recycle? If the numbers reflect that, peak mined silver would be debunked.
Silver’s time
The Fed is arguably bumbling into a similar policy mistake that they made in the 1970s, that of cutting rates too soon after an initial inflation spike in July.
Will the Fed cause an inflation mountain by lowering rates too soon? — Richard Mills
US producer prices increased by the most in three years in July amid a surge in the costs of goods and services,
Companies are starting to pass on higher input costs to their customers after months of “eating them”. The higher costs are weighing on corporate earnings, putting shareholder pressure on firms to maintain profit margins and “pass through” the tariffs.
The Producer Price Index (PPI) in July rose 0.9% from June, the largest advance since consumer inflation peaked in June 2022, said a report by the Bureau of Labor Statistics (BLS). It climbed 3.3% from a year ago.
The Personal Consumption Expenditures (PCE) price index was +2.6% in July, and the core PCE (goods and services minus food and fuel, and the Fed’s preferred measure of inflation) was +2.9%, up from 2.8% in June and the highest since February.
Economist Torsten Slok warned about this at the Jackson Hole Symposium in August, where he said the Fed see structural distortions from tariffs and immigration policy.
(Tariffs are inflationary because they force importers to pay an extra “tax” on imports, that are eventually passed onto consumers. Immigration restrictions are inflationary because they pull workers out of the economy. The removal of workers is pushing up wages in industries like agriculture, construction and hospitality.)
If those forces keep inflation sticky and Powell cuts rates, as he’s under pressure from the White House to do, Slok wrote that he could be vulnerable to a 1970s-style “stop-go” policy mistake — the backdrop for the second inflation mountain.
In such a scenario, reminiscent of the ‘70s, if the Fed loosens policy prematurely, inflation could spike, leading to the painful corrective measures seen under Powell’s predecessor Paul Volcker, who hiked rates aggressively and weathered severe, double-dip recessions. — Fortune
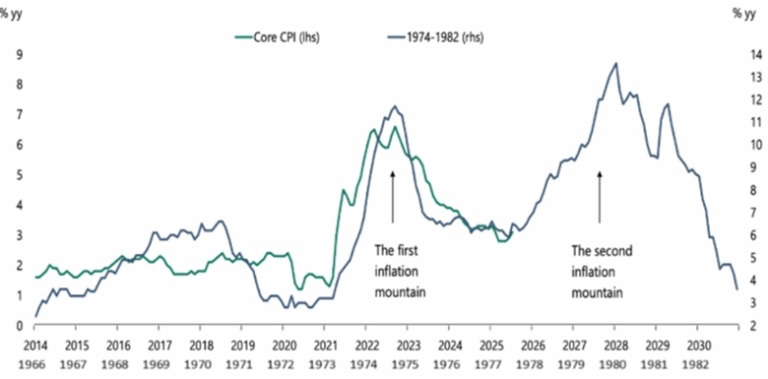
Source: Apollo Global Management
Trump is highly motivated to get the Fed to cut interest rates so that he doesn’t have to finance the national debt at higher rates when US Treasury bonds roll over. It looks like Trump will get his wish.
He nominated Stephen Miran, chair of the Council of Economic Advisors, to replace Adriana Kugler on the Federal Reserve Board of Governors. Fed Governor Christopher Waller, viewed as more dovish, could be Trump’s pick to lead the central bank, reinforcing expectations of easier policy. Trump could either fire Powell or wait until his term ends next May before appointing a successor more to his liking.
Gold’s real secular move has yet to even begin – Richard Mills
Interest rate cuts are a tailwind for precious metals. Gold is up over a third year to date, hitting $3,500 an ounce for the first time last week. Silver had done even better, rising 42%.
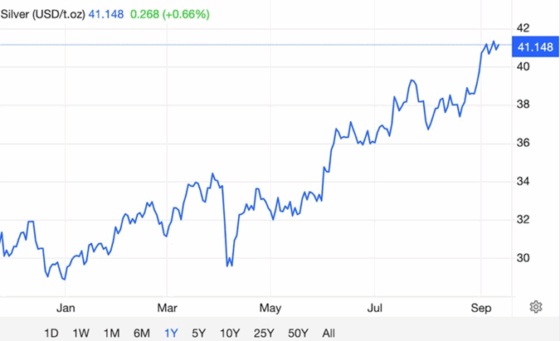
One-year silver chart. Source: Trading Economics
The dollar, meanwhile, suffered its worst first-half performance in 50 years. A low dollar is generally good news for gold/silver and gold/silver stocks.
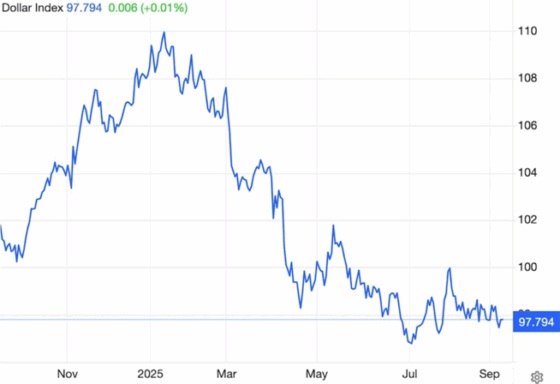
One-year DXY. Source: Trading Economics
Barron’s pointed out that gold is getting a tailwind from buying by central banks, and said that gold’s recent rally, and the signals it echoes, shouldn’t be dismissed as merely an inflation warning. It is a signal that the US is at risk of losing its role at the center of the financial system as doubts rise about the dollar’s long-term value.
Peter Schiff compares the beleaguered dollar to the Roman denarius which used to represent a fair day’s wage for soldiers and laborers. Eventually the denarius, like the dollar, became debased, and within a few generations, it could hardly buy basic staples like bread. For centuries there was a monetary vacuum — other coins tried to replace the denarius but none ever could. The dollar is approaching a similar vacuum. With no trustworthy alternative to take its place as the global reserve currency, central banks are buying gold.
Influential investor and financial commentator Ray Dalio recently warned that the US dollar and other reserve currencies are waning in appeal due to high government debt burdens. The US government’s debt-service payments now equal about a trillion dollars a year in interest, with about $9 trillion needed to refinance the debt which will mature this year.
A top economist says the US is at the ‘Edge of the cliff’ and in a full-blown labor recession that risks spilling into the rest of the economy.
Moody’s economist Mark Zandi has been closely watching what he describes as a “labor recession” unfold, with revisions for June showing a contracting workforce for the first time since 2020. Last Friday’s report did nothing to dissuade him of the notion, and now the Moody’s economist told Business Insider he’s looking ahead for signs that the job-market downturn could spill into the broader economy.
Could history repeat itself and lead to stagflation? The signs are worrying.
In 1979, then US Federal Reserve Chair Paul Volcker faced a serious challenge: how to quell inflation which had been wracking the economy for most of the decade.
Not only was inflation going through the roof, but economic growth had stalled, and unemployment was high, rising from 5.1% in January 1974 to 9% in May 1975. In this low-growth, hyperinflationary environment we had “stagflation”.
Volcker is widely credited with curbing inflation, but in doing so, he is also criticized for causing the 1980-82 recession. He did it by aggressively raising the federal funds rate. From an average 11.2% in 1979, Volcker and his board of governors through a series of rate hikes increased the FFR to 20% in June 1981. This led to a rise in the prime rate to 21.5%, which was the tipping point for the recession to follow.
If the Fed carries through with an interest rate cut in September, and potentially two more cuts before the end of the year, amid rising inflation, a second inflation mountain similar to the one that grew between 1978 and 1982 could easily form between 2026 and 2028.
If the employment situation worsens and inflation keeps climbing, look for economic growth to sputter as the US enters stagflation.
According to economist and Project Syndicate author Stephen Roach,
The supply-chain disruptions during the pandemic look almost quaint compared to the fundamental reordering of global trade currently underway. This fracturing, when coupled with US President Donald Trump’s attacks on central-bank independence and preference for a weaker dollar, threatens a prolonged period of stagflation. — Stagflation for the Ages
How has gold done during stagflation? As it turns out, quite well.
In fact, gold outperforms other asset classes during times of economic stagnation and higher prices. Of the four business cycle phases since 1973, stagflation is the most supportive of gold, and the worst for stocks, whose investors get squeezed by rising costs and falling revenues. Gold returned 32.2% during stagflation compared to 9.6% for US Treasury bonds and -11.6% for equities.
The resumption of the Fed’s cutting cycle means that gold and silver should outperform even a hot equity market, states Sameer Samana, head of Global Equities and Real Assets at Wells Fargo Investment Institute.
“It’s becoming harder and harder to make a bear case for really anything other than bonds, given this pivot by the Fed,” Sameer said via Kitco.
Goldmoney’s Alasdair Macleod said during the first week of September that “There’s growing appreciation that the gold and silver bull has returned,” noting the Sept. 2-5 price action was a turning point.
Among the background factors driving bullish silver and gold chart action were plans for a non-dollar currency area; a developing G7 bond crisis; and technical analysis pointing to higher gold and silver prices.
He notes the prospect of the gold-silver ratio declining from its current 88 to 50, pushed down by the falling dollar. “With gold at $4,000 and a ratio of 50, that makes silver $80. This is not a forecast, only an illustration of silver’s potential,” Macleod writes.
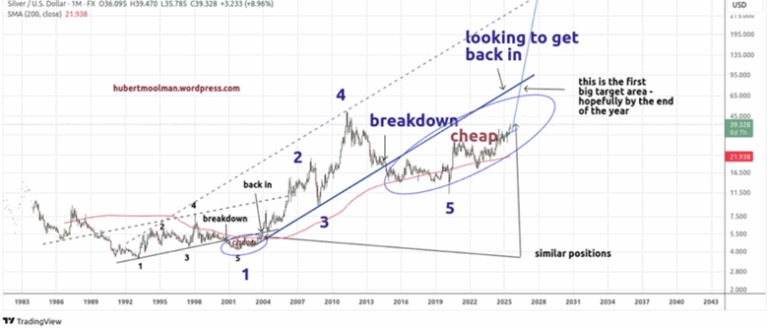
Precious metals analyst Hubert Moolman posted a Silver/ US Dollar chart dating from 1983. He says that based on the fractal in the chart (a fractal is a pattern of five consecutive price bars that signals a potential trend reversal or continuation), “it is expected that we are now likely in a sustained silver rally similar to 2010-2011, for example.” Silver hit an all-time high of $49.51 in April 2011.
Further, Moolman showed in a previous article that significant silver peaks occurred within 8.5 years after the Dow/gold ratio peak, with the Great Depression silver peak occurring the soonest (6 to 7 years after).
“Given that silver actually rallied on a sustained basis for at least 2 years before each of these peaks, we are likely to see silver rally for most of the coming 20 months,” he wrote.
FX Empire wrote that Silver climbed within striking distance of $42 an ounce on Monday, posting its strongest rally since 2011 as a deteriorating U.S labour market reinforced expectations of a September Fed rate cut.
If the Fed makes a “jumbo rate cut” of 50-bp, it “could send precious metal prices into the stratosphere,” FX Empire predicts.
The publication says momentum points to higher highs beyond the 42% gain silver has already made this year:
- Flows into physical Silver and ETFs continue to accelerate. “Every indicator we track is flashing green” says GSC Commodity Intelligence. “Institutional positioning, ETF inflows and physical demand are all converging to create what we believe is the most powerful setup for Silver in more than a decade.”
- Labour market weakness has cemented the case for monetary easing, while persistent inflation ensures real yields remain negative. At the same time, geopolitical uncertainty – from tariff disputes to renewed trade tensions amplifies safe-haven demand. “The asymmetry of risk-reward is staggering” adds GSC Commodity Intelligence. “A single well-timed position in Silver could quickly deliver what used to take months – if not years – to achieve.”
- If policymakers opt for a 50 basis-point cut, such a decision would be the textbook trigger for a new Supercycle – a sustained multi-year uptrend in Commodities last seen during the post-2008 Global Financial Crisis.
- Beyond monetary policy, Silver’s fundamentals are screaming higher. The market is on course to register its fifth consecutive annual supply deficit with mine output unable to keep pace with industrial demand. Consumption is exploding across growth sectors. Solar panels and renewable technologies continue to absorb increasing volumes of Silver thanks to its unmatched conductivity. The expansion of electric vehicles and electrification infrastructure is also fuelling demand, while AI data centres and semi-conductors are adding an entirely new dimension of structural consumption.
“Structural deficits are colliding with an unprecedented demand boom,” explains GSC Commodity Intelligence. “This is the kind of perfect storm that doesn’t come around often. Breakouts above the $40–$42 resistance zone unlock a direct path to $50 an ounce – and once that level gives way, the market will move faster than most traders can imagine.”
Surging lease rates are another indication of a tightening silver market.
Silver lease rates are the interest rates that borrowers pay to lease or borrow physical silver. Elevated lease rates often indicate a tightening physical market, where it’s more difficult or expensive to obtain physical silver.
Bloomberg wrote on Sept. 8 that traders fear possible tariffs on silver could squeeze already tight supplies in London, where inventories have dwindled as investors pile into gold and silver ETFs.
That scarcity is already filtering through to the market. Silver futures on Comex are trading at an elevated premium of about 70 cents above London’s benchmark spot price, and the cost of borrowing silver in the UK capital on a short-term basis has spiked above 5% for the fifth time this year — well above historical levels of near-zero…
“If you look at US ETF holdings, they’ve absolutely exploded. So there’s been ongoing demand,” said David Wilson, senior commodities strategist at BNP Paribas SA.
Richard (Rick) Mills
aheadoftheherd.com
********
More from Silver Phoenix 500


