Silver – A Change In Behavior. Enough For A Bottom?


One of the largest issues many have with technical analysis is linking an understanding of their fundamental “beliefs” with prices on a chart. By fundamental, we include simply the knowledge of any number of known factors, shortages, record buying of coins, people generally positive about the “news,” as a few simple examples. There is a need for a hand-to-eye type of association between existing fundamental “beliefs” and current prices.
Beliefs are formed opinions about reality, but not necessarily reality itself. Change the belief, and you change the reality. The current wide-spread belief is that there is a huge shortage in silver, relative to the demand. From that belief an expectation of higher prices arises. The reality is, for whatever reason, price has declined to levels that have surprised almost all who follow the silver market, and gold, as well.
Technical analysis is a measure different from fundamental analysis. We will depart even more by qualifying our approach as a specialized subset of technical analysis. How so? We read price and volume behavior, over time, in the form of developing market activity. It is what one sees on a chart, price ranges, close locations, volume, time factor[s], but no more.
We do not use artificial tools like Relative Strength, Fibonacci, Bollinger Bands, MACD, Elliott Wave, even moving averages. From our view, they are past tense information being imposed upon present tense activity with the expectation of divining the future.
Developing market activity captures all of the KNOWN buy/sell decisions that impact the market. Anything that does not translate into executed prices remains an opinion about the market and has no direct effect on price. What is the difference? An executed price is an opinion that has been converted into an action, and we want to know what the results are from those actions, for they derive from smart, sophisticated players, with the most informed sources, the strong hands, all the way down to the least informed, weak hands, with a variety of skills in between.
It is this collective that makes the market, and they are best seen in the charts, via price ranges and volume, over time. It is the truest form of market reality from which a myriad set of beliefs about that reality follows.
What we endeavor to do is follow the market’s lead through the use of a set of rules for engagement. The first rule is to know the trend because it is the trend that dictates how to position oneself in the market, always with the trend. There is less of a hand-to-eye bias. It is the trend that is reality, whatever one’s belief about that reality may be.
With this editorial, we turn to the charts, ignoring the fundamentals, all the news. All we need to know has already been “priced in.” Everything else is an expectation based on news and fundamentals, and they do not always go hand-in-hand with market reality. The best example we can cite is where price expectations are/have been within the precious metals community, $50, $150, $300, and where the reality of price is, by sharp contrast, just under $20.
We are on long-standing record exhorting the purchase, and personal holding, of physical precious metals, with no recommendation for buying/holding paper futures. The two are now separate and distinct. Buy the physical at current prices, for they are likely to be the lowest prices for the next several years, possibly decades.
What is presented below are charts for the paper futures markets, currently the only price mechanism for silver and gold. That may be coming to an end, sooner now rather than later, but for now, it is what it is, and what is is reality.
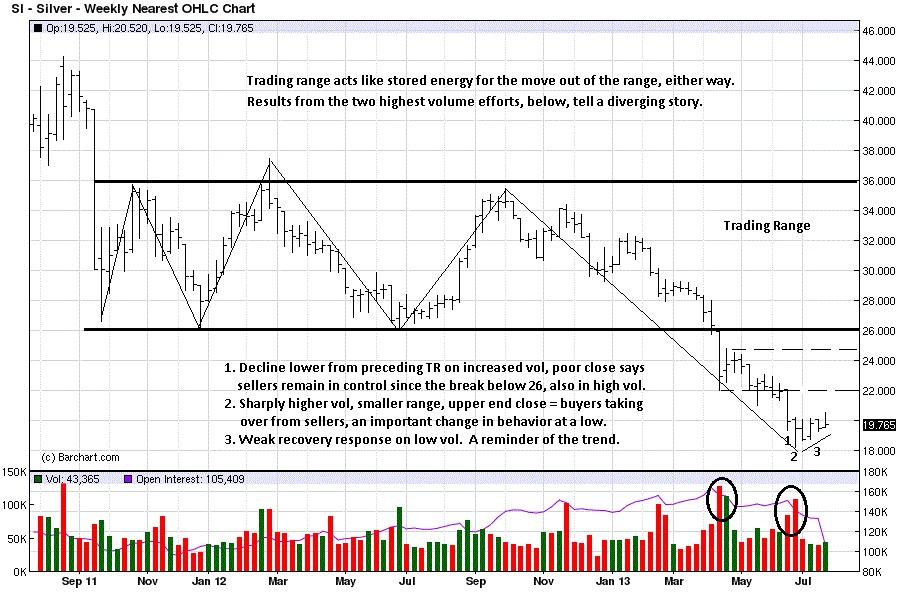
The primary purpose of a trading range, [TR], is to set the stage for the next move that follows from whichever way price leaves the TR. It is a form of “stored energy,” as either buyers absorb sellers prior to a rally higher, or sellers absorb buyers prior to a decline lower.
Once price moves directionally, establishing that all-important trend, there should be on-going market activity to confirm market direction. We will not go into what is believed by most to be a purposeful, and artificial attempt to suppress precious metal prices. If that is the case, it will show up in price behavior. The futures markets attract some of the best minds in the world because of the opportunity of phenomenal rewards. Smart money is not fooled for very long, if at all.
We are not showing the larger time frame charts, monthly, quarterly, annually, but an argument can be made that they remain in bull trends undergoing a correction. Few who trade futures ever look at those charts, and we are looking for change in the present tense.
There was a large volume break, some would call it a surprise bear raid, on exceptionally high volume. If the stored energy in the trend was distribution, there should be a sizeable and strong move lower. Rather than continue immediately lower, price moved sideways, eventually hugging the 22 level.
When price stays near a price, up or down, it will generally break in the same direction preceding its arrival. 22 did give way and did so on high volume, again. However, a closer inspection does not support lower prices. Keep in mind, as you look at price and volume development, you are seeing, firsthand, how market movers are translating their information into buy/sell decisions, and how those decisions are impacting the market.
In the first two-day volume effort, the exceptionally high volume first bar was followed by another high volume buy effort. It is considered a buy effort because price closed higher. What needs to be asked is, what was the result of all that buying effort? There was none. Price failed to follow through to the upside. This is important market information.
If price cannot go higher after such an effort from buyers, who is really in control? Sellers. What is the trend? Down. Who controls in a down trend? Sellers. Did sellers just prove they could stop buyers cold? Yes. What does that mean for prices? Still lower. Did price go lower? Yes. Did developing price activity give us confirming information that price would go lower? Yes. Did it require guesswork? No, just applied logic in following developing market activity.
As an aside, do you think RSI, Bollinger Bands, moving averages, etc, could have reflected this information, at that point? Absolutely not. They may have already been pointing down, but could not convey the same information just determined by the market itself.
The next two designated volume bars provide more information. [High volume activity is almost always a sign of smart money activity. The public does not generate this level of volume, they only respond to it, usually on the other side, by smart money intent.]
There is another break lower, from weak support at 22, which is what the “hugging” of that level “told us,” as it was happening. We “knew,” in advance, that 22 would likely give way, and it did. So another break, just as price broke the 26 level, but there appears to be a difference, and differences can lead to clues.
Compare the volume on the break from 22 to that of the break from 26. It is much less. Relatively less volume means less relatively less selling effort. Why? This is a great opportunity to keep buyers under duress. Also, the range of the bar breaking 22 is not as large as the bar breaking under 26. Downside momentum is lessening.
What happens next day is opposite to what happened previously. This time, volume increased sharply over the previous day, and note both the size of the bar and the close location. The bar is smaller on increased volume. [Increased volume equals increased effort.] Logic tells us it is smaller because buyers were not only meeting the effort of sellers, they stopped all sellers efforts cold!
Look at the location of the close: upper end. If sellers were in control the close would have been on the lower half of the bar. We are being given immediate market information from the best available source, the market itself. The momentum to the downside just came to an end, at least to those of us reading developing market activity, according to the read of 1 and 2 on the chart.
3 shows a weak rally response, after the fact. This is a reminder of how a trend has to be respected for it takes time to change one. No artificial technical tools could have presented this information, not on these days, and not in such an informative manner.
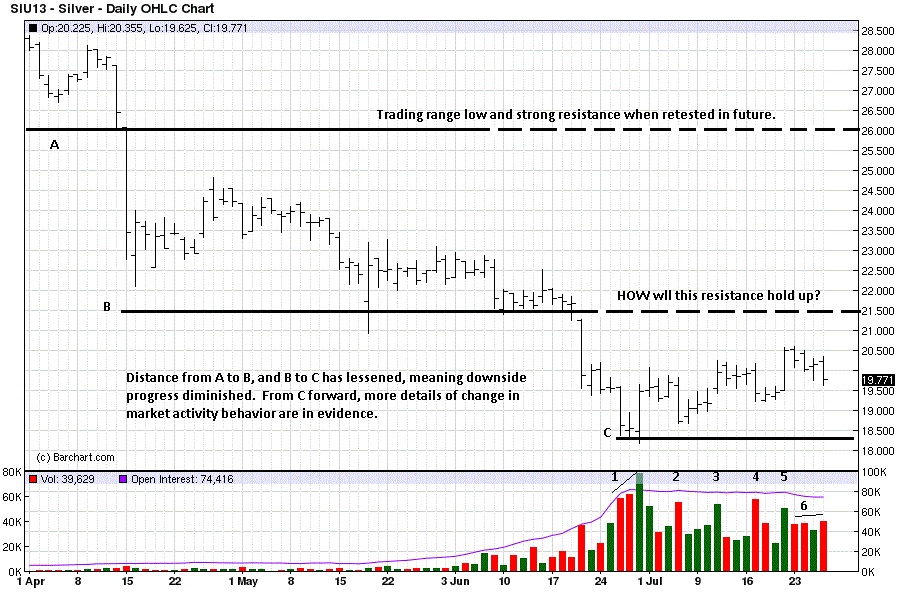
We look to the daily chart for more detail and maybe more clarity.
What needs to be noted is the decline in downward momentum from price level A to B, relative to the next decline from B to C. If momentum is losing its force, it should show up and confirm it in market activity.
There is a series of numbers, 1 through 6, that alerts us to a change in market behavior. It cannot be stressed enough to remember that we are “reading” the decisions and intent of smart money as they execute in real-time in the market. Follow the logic:
1. Increased volume, wide range down, low close. Sellers in control. Next bar, higher volume, smaller range, no downside given the increased effort, and the smaller range tells us sellers lost control to buyers, at least on that day. This is a red flag, a warning for shorts/sellers.
2. Increased selling effort, again with no downside follow through. Another red flag.
3. A rally day on increased volume. There is no upside follow through, but no downside.
4. Another increased selling bar, poor close, and again, no downside follow through, and a lost opportunity to cancel the buying effort from 3.
5. After two days of marking time, after 4, a strong rally and close on increased volume, with the close above all the selling effort of the past month. This is clearly a change in market behavior by smart money.
6. After 3, price failed at 4. After bar 5, it has taken 4 days, three of which are selling efforts, and the last one the highest volume effort, but the 4 day effort did not erase the single rally bar 5. That is a relative sign of strength when price is near its lows after a protracted decline from $50.
It is too soon to know if this is a bottom. What can be said is that rallies within a down trend are normal, and if a rally ensues from here, that part can be expected without making a determination of a trend change. It takes time to change a trend, and a change starts on the lower time frames, but we do not have enough evidence to call this a bottom, at least in the paper futures market.
A lack of downside follow through on Monday, with rallies on strong volume would tell us to expect a challenge of the 21.50 area. Let the market lead. It always does.
[Written Sunday afternoon].
- See more at: http://edgetraderplus.com/market-commentaries/silver-a-change-in-behavio...
More from Silver Phoenix 500


