Silver, Baby!


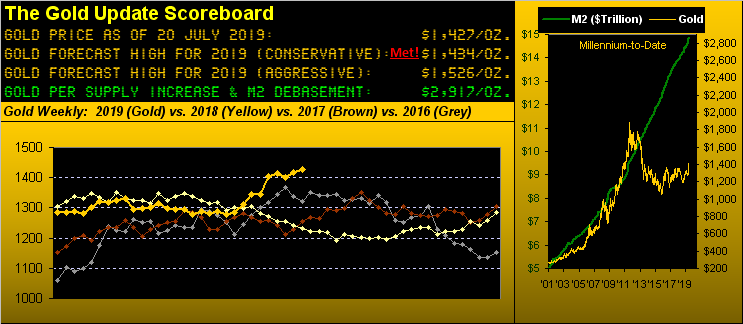
Gold just made a new high for the year at 1454. That "ought be" the story, right? Not really. In fact, nothing really has changed for Gold from a week ago wherein we categorized its performance for what now has been four weeks as "blah" despite all the "rah-rah". Up with the geo-political news, down with the geo-political news; up into the mid-1400s congestion, down from the mid-1400s congestion. Indeed after making that marginal high early in yesterday's (Friday's) session, price tumbled a right 33 points to as low as 1421 before settling out the week at 1427, nevertheless netting a nine-point gain for the week, (+0.6%). Here are Gold's weekly bars, the recent consolidation continuing with an upside bias:

Silver's gain for the week was +6.5%, such move standing out as the shiniest star in the sky. Tuesday's session alone was quintessentially exemplary of that: for the eight entities that comprise the comprehensive set of the BEGOS Markets (Bond, Euro/Swiss, Gold/Silver/Copper, Oil, S&P), seven of them finished the session in the red ... only Sister Silver posted a gain for that day. Silver, Baby! Here are Silver's weekly bars which rarely we present, but 'twould be precious metals sacrilege to not so do this time 'round ... and unlike the above Gold bars, this ain't no consolidation, (look up "break-out" in yer Funkin' Wagnalls):
But wait, there's more. The Gold/Silver ratio, which as denoted above still is inanely high at 87.9x, has nonetheless come a least a tad off the boil, being as high as 93.1x on 10 July. But now with Silver suggesting she's geared to start catching up to Gold, let's look at their respective year-to-date percentage performance tracks (Gold +11.0% and Silver +4.3% ... the latter a week ago instead -2.0% in 2019). And as the lower panel in this next graphic shows, the Gold/Silver ratio due to Silver's scintillating performance this past week has sharply turned down:
" 'Scintillating', mmb? "
Millennium-to-date, Squire, there've been 968 trading weeks. This past one ranks as Silver's 52nd best by that 6.5% percentage gain. "Ho-hum..." say you? We say there've thus been 51 other weeks that have done even better, eight of them returning double-digit gains! Regardless of whether or not like weeks are imminent, we don't know. But they're out there -- and moreover in the scheme of the still very skewed Gold/Silver ratio -- well overdue. Silver, Baby!
In fact, let's put a real silvery shine on this. Per the opening Gold Scoreboard, we value the yellow metal's price today given StateSide currency debasement at 2917. Then factor in the millennium-to-date average of the Gold/Silver ratio at 64.5x. The resulting arithmetic? 2917 ÷ 64.5 = 45 for the price of the white metal. And to recall that 49 already traded back on 25 April 2011? That's triple the present price. Which means for a Silver equity that might typically be leveraged three times the metal's movement, 'twould be nonuple the present price. "The possibilities are endless!"
Speaking of precious metals equities, a core reader/active trader shared these thoughts with us into week's end, with permission and as highlighted under our massive disclaimer umbrella:
"...even the pigs are flying, i.e., GDX up 4.2 %, SIL 3.1 %. Why pigs? Each of these ETFs is burdened with a fair number of mediocre names acting as a weight upon their performances for years, so why not in the case of silver buy/trade AG, PAAS, and WPM and call it a day? Re GDX, I'd rather commit ... to AEM, NEM, GOLD and FNV, roughly in order, ceteris paribus - I don't want exposure to the other names. But no doubt the institutional boys who just want some exposure to the space are content to pick up a little GDX, and, not as well known SIL ... I view ETF GDXJ differently - a great way to pick up smaller but still mid-cap exposure to high quality gold & silver producers - not really juniors. This has some juice in it, and tends to trade in sympathy with the silvers..."
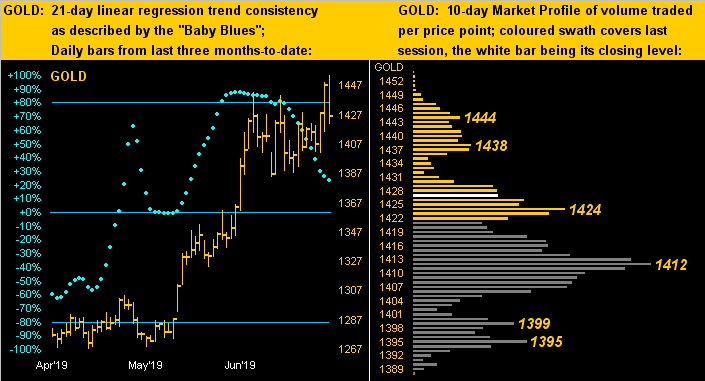
Sympathy, indeed. And for the week with SIL +8.9% and SLVP +9.3%, GDX was +6.5% and GDXJ +10.2%. Yet might we be sympathetic toward Gold in the ensuing trading days? In turning to the following two-panel graphic of Gold's daily bars from three months ago-to-date on the left and the 10-day Market Profile on the right, we find the baby blue dots of linear regression trend consistency falling away as price had been working higher until Friday's downside reversal. As for the Profile with its denoted volume price apices, 1412 shows as a key trading support:
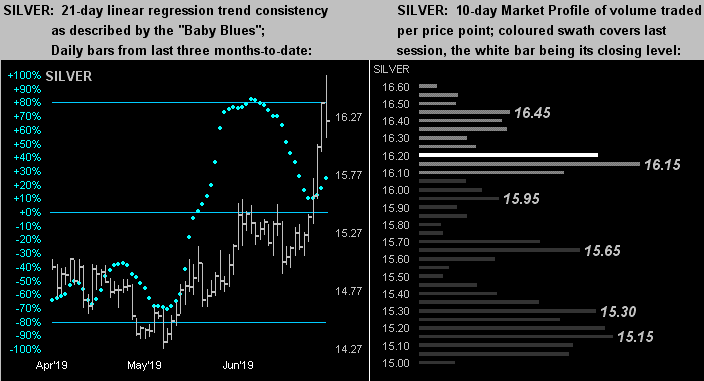
Silver's display obviously is far more dramatic, her "Baby Blues" (below left) turning back up before having even reached down to their centered 0% axis. As well per her Profile (below right), 'tis peppered with various support prices. Months, dare we say years, have passed since she's showed this much sizzle. Silver, Baby!
Sizzle-less remains our Economic Barometer. And various voices of FedSpeak, albeit a year in arrears, finally see it, including of late ChiFedHead Charles Evans who says "a couple of rate cuts" are needed to fuel an otherwise dwindling inflation flame. One wonders if, in a separate sense, rate cuts are necessary, or if 'tis all just too late as recessive trends -- the Econ Baro being a comprehensive composite blend -- rear their heads. And 'tis not only here: in issuing a report from someplace called Bengaluru, a Reuters poll sees the European Central Bank slicing its deposit rate come September another -0.1% to the -0.5% level: "Take our dough, please! We'll pay you!" Whirling the other way 'round the world, China's Gross Domestic Product growth pace has purportedly slowed to a 30-year low. Oh no. Meanwhile with Q2 Earnings Season underway, 60 of the S&P 500's constituents have reported, with (as we're told) 75% of them beating estimates, but (as we're not told) only 68% of them with better bottom lines. How's that 32.5x "live" price/earnings ratio workin' out for ya? Here's the Baro:
And then there's the $22 trillion StateSide debt limit. Raise the ceiling, else cuts kick in. Oh no again. 'Tis as good a time as any to assess where Gold has cut a swath within its stack:
The Gold Stack
Gold's Value per Dollar Debasement, (from our opening "Scoreboard"): 2917
Gold’s All-Time High: 1923 (06 September 2011)
The Gateway to 2000: 1900+
Gold’s All-Time Closing High: 1900 (22 August 2011)
The Final Frontier: 1800-1900
The Northern Front: 1750-1800
On Maneuvers: 1579-1750
The Floor: 1466-1579
Le Sous-sol: Sub-1466
2019's High: 1454 (19 July)
10-Session directional range: up to 1454 (from 1388) = +66 points or +4.8%
Trading Resistance: 1438 / 1444
Gold Currently: 1427, (expected daily trading range ["EDTR"]: 24 points)
Trading Support: 1424 / 1412 / 1399 / 1395
10-Session “volume-weighted” average price magnet: 1416
Base Camp: 1377
The 1360s Double-Top: (1362 in Sep '17 and 1369 in Apr '18)
The Weekly Parabolic Price to flip Short: 1344
Neverland: The Whiny 1290s
The Box: 1280-1240
The 300-Day Moving Average: 1275 and rising
2019's Low: 1267 (02 May)
The ensuing week's highlight? Friday's (26 July's) first peek at our Q2 Gross Domestic Product. 'Tis supposed to be nearly half that of Q1's 3.1% annualized growth pace. So keep pace in mind, too, with respect to the precious metals ... and whilst nothing perpetuates up in a straight line, our Sister's a rising star: Silver, Baby!
www.deMeadville.com
www.TheGoldUpdate.com
********
More from Silver Phoenix 500


