Silver Breaks 6000 And the Bulls Aren’t Done Yet
 share
share
 share
share
 share
share
 share
share
 share
share
Last week’s scenario? Played out perfectly.
Silver bulls smashed through the key red resistance zone just above 5900, closed the gap, and broke that long-standing psychological wall at 6000. What happened next? A textbook follow-through. Asia picked up the bullish baton, the market gapped higher and silver… printed fresh highs at 6213.50.
So, what now?
With daily indicators flashing warning signals, and key technical levels getting closer… we’re entering a zone where momentum, discipline and precision matter most.
Daily Chart (D1): The Breakout That Ignited the Fire

In our Friday’s Lab Note #29, we wrote the following:
(…) the critical support zone (the upper line of the purple rising channel + Monday’s green gap) did its job perfectly. Bears attacked it... and got rejected.
(…) red zone still acts as the final roadblock before a run at the psychological barrier of 6000. If bulls close above it, the path opens for higher targets we mapped in Lab Note #20.
At this point, it is worth noting that if price breaks out of the current orange consolidation range to the upside, it unlocks a measured move to 6200, where the size of the upswing will be equal to the height of the mentioned formation. (…)
Well, that’s exactly what happened.
Friday’s red zone? Obliterated. The 6000 wall? Shattered.
Today’s Asian session? Opened with a bullish gap (6084-6111), which pushed us all the way to 6213.50 (overshooting even the 6200 projection) in the following hours. At this point, it is worth noting that the above-mentioned green gap serves now as the first important support (if the bears try to correct recent upward move).
But here’s the nuance:
All three key daily indicators (CCI, Stochastics, and RSI) are now in overbought territory.
Translation for beginners:
- CCI > +100 = strong trend but nearing exhaustion
- Stochastics > 90 = early warning of slowing momentum
- RSI > 70 = bullish strength, but ripe for a pullback
So… while bulls are still in control, it’s not the moment to chase blindly. Tactical awareness is the key.
Having said that, let’s examine lower timeframe.
H4 Chart: Measured Move in Progress
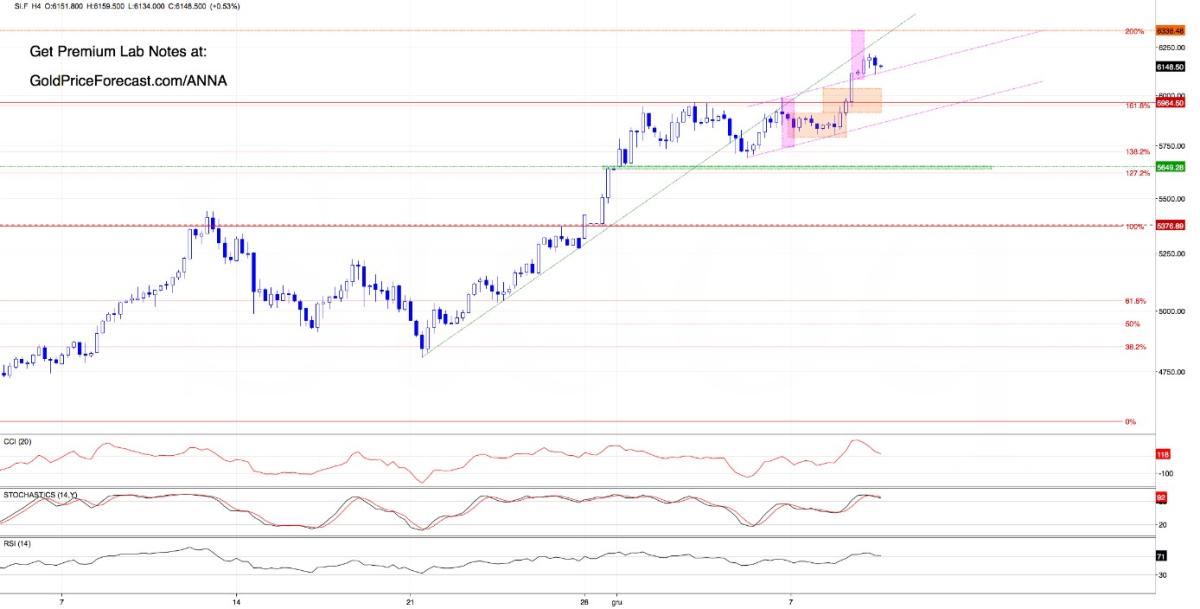
The first thing that catches the eye on the above chart is breakout above the pink rising channel, which confirms bullish continuation. Therefore, if the move continues, the next stop could be around 6338-6340.
Why there?
Because in this zone the size of the upswing would be equal to the height of the broken channel. Additionally, in this area there is also the 200% Fibonacci extension.
This is where bears may attempt a comeback - especially if a fresh sell signals appears.
But let’s be clear:
As long as the breakout remains intact (silver stays above the upper line of that broken pink channel, today’s green gap is open and the barrier of 6000 holds), buyers remain in control.
What could happen if bulls push silver above 6340? In my opinion, the door swings open for the next leg higher - the same upper targets we outlined in Lab Note #20:
(…) What Comes Next (And Why These Levels Matter)
Here’s where it gets interesting: the target levels ahead aren’t random - they’re built from: the breakout structures, Fibonacci extensions, channel projections… all pointing to a tight cluster of upside zones. That kind of multi‑method convergence is usually meaningful.
Key upside zones if silver keeps pushing:
6000 -> the next psychologically very important barrier
around 6100 -> the 173.2% Fibonacci extension
around 6260 -> full measured move from the breakout above the green wedge
around 6355 -> the 200% Fibonacci extension
6500 -> the next important round number + full measured move from the breakout above the purple rising channel
These are not “targets to trade blindly.” They’re map points - areas where the market tends to reveal what comes next: continuation… or exhaustion. (…)
My Takeaway: Here’s What to Watch Now
- Watch today’s gap zone for any dip-buying interest.
- 6338 is the next likely upside target and bulls may lock in profits here - be ready.
- Daily signals from all indicators are hot and if very short-term reversal signs appear, don’t ignore them. Take tactical profits or scale down risk.
- But above 6340? It’s go-time again. In other words, such price action would confirm a sustained breakout with more room to run.
Final thought: silver just gave us a textbook breakout… and might be setting up for another.
You don’t want to miss the next move.
Stay sharp, stay tactical. See you on the next chart.
********
share
share
share
share
share