Silver Corrects Again - Not So Calm Before The Storm


Silver prices have been volatile in 2020 as the precious metal has traded in a range from $17.28 to $18.895 on the nearby March futures contract since the end of last year. Like gold, silver is money and one of the oldest means of exchange in the world. Gold has been attracting buying during the latest risk-off period in markets. The price of silver was stable, until January 28 and 29 when selling took it to a new low for this young year. Many other markets had been moving lower on fears of the spread of the Coronavirus over recent sessions. At first, gold and silver prices had held up quite well. Last Tuesday and Wednesday, silver fell by over 80 cents per ounce, which turned out to be another buying opportunity for silver devotees.
Silver and gold moved higher when the Fed cut interest rates in July 2019. The increased tensions in the Middle East earlier this month caused buying in gold and silver markets. Silver tends to exhibit more volatility than gold, but bull market trends remained intact in both metals at the end of last week.
If silver is sitting on a launchpad that will take the price over its level of critical technical resistance at the July 2016 high, the Velocity Shares 3X Long Silver ETN product (USLV) will magnify the price action on the upside. USLV can be an excellent trading tool for those looking to buy silver during periods of price weakness and take profits when the buying returns to the volatile precious metal.
Silver has lagged gold
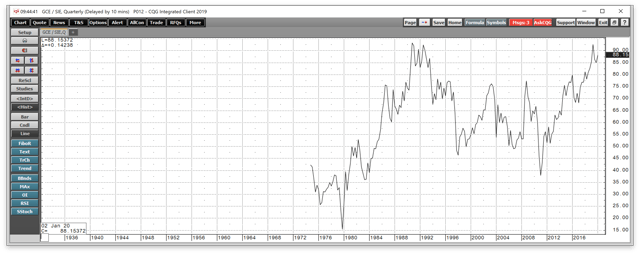
Since the 1970s, the average price relationship between silver and gold has been around fifty-five ounces of silver value in each ounce of gold value. The silver-gold ratio dates back thousands of years to when the first Egyptian Pharaoh, Menes, declared that two and one-half parts silver equals one-part gold.
Source: CQG
The quarterly chart highlights that the range in the ratio has been from 15.47 to 93.18 ounces of silver value in each ounce of gold value since 1974. At the 88.15 level on January 31, after the latest round of volatility in the silver futures market, the ratio is sitting a stone's throw away from the high over the past 46 years.
On a historical basis, when the ratio moves above the 55:1 level, silver is inexpensive when compared to the price of gold. At 88.15, silver is downright cheap.
Silver has lagged the price action in the gold market. While gold broke out to the upside in June 2019, above its July 2016 high of $1377.50, silver could not achieve that feat as it remained below its 2016 high.
Silver can be a volatile beast
The price action in the silver futures market on Tuesday, January 28, was a reminder of silver's penchant for volatility.
Source: CQG
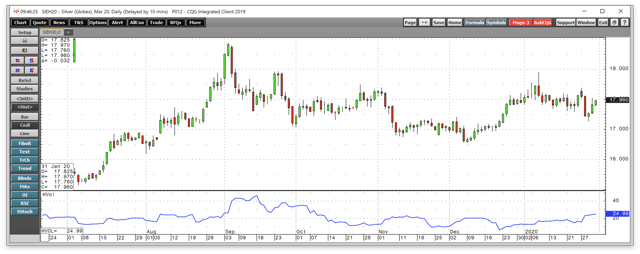
The daily chart shows that the price dropped from over $18 to $17.42 per ounce on January 28, and to a low of $17.28 the next day. While other markets stabilized on Tuesday after losses since earlier this month through January 27, silver decided to take an elevator lower. The price then spent the rest of last week recovering. Daily historical volatility in the silver market rose from 6.57% in late December to around 25% recently. On January 31, the metric that measures price variance moved to 24.99%, the highest level since last October.
Long-term volatility in the silver market remains at its lowest level in many years.
Source: CQG
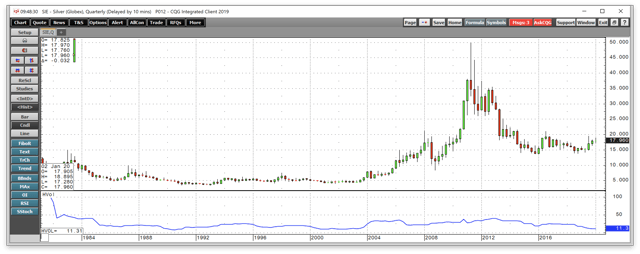
The quarterly chart illustrates that at 11.3%, the metric is at its lowest level in seventeen years, since 2003.
Silver likes to move when the market least expects
The low level of historical volatility on the quarterly chart suggests that silver is a lot like a rubber band that someone is pulling in opposite directions these days. Rising tension in each direction will eventually cause the band to snap, leading to a significant price move.
The silver futures market is a master when it comes to head-fake moves that confuse market participants. After the move to the downside on January 28 and 29, speculative shorts were likely licking their chops at the bearish technical pattern that developed on the weekly chart.
Source: CQG
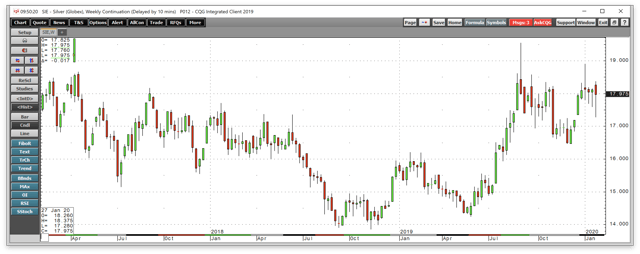
The weekly pictorial shows that if silver had settles below $17.59 on Friday, January 31, it would have put in a bearish reversal on the weekly chart, which often leads to further selling. However, the price recovered an avoided the technical pattern as silver was just below the $18 once again on the final day of January.
I have been trading silver since the early 1980s, and the one thing I have learned is that the precious metal often fakes out market participants before making a significant move. Trading silver can be like riding a psychotic horse through a burning barn when it comes to volatility. The recent price action was another in a long series of buying opportunities in the silver market since the price reached a bottom at $13.635 per ounce in late 2015.
Above $21.095 we could see an explosive move
In June, gold rose above its 2016 high and level of technical resistance of $1377.50 and has not returned to that price. Gold was trading at just below the $1590 level at the end of last week on the April futures contract. Meanwhile, in July 2016, silver rose to a peak of $21.095. In September 2019, when gold reached $1559.80, silver only made it to a peak of $19.54. Gold made an even higher high of $1613.30 per ounce on January 8, but silver only made it to a lower high of $18.895. Silver has been lagging gold, and the series of lower highs since September is a bearish technical sign for the metal. However, the continuation of strength in the gold market could cause a sudden wave of buying to move into silver, particularly if gold remains in bullish mode.
A move above the July 2016 high of $21.095 per ounce on the nearby COMEX silver futures contract could unleash a tidal wave of buying. Above the technical resistance level, the sentiment would likely shift, and trend-following systems and speculators could flock into silver, pushing the price appreciably higher. Like gold, silver has a long history as a hard currency. The price action in the gold market since June 2019 is warning us not to become overly bearish on silver and that the odds favor that the current price weakness is another buying opportunity.
USLV magnifies the upside, but timing is everything
Buying silver when the price is declining can be a stomach-wrenching process. It is virtually impossible to pick a bottom in any market, and silver always looks its worst when the price reaches a bottom.
The price of silver was heading lower last week, but found a short-term bottom and recovered. A challenge of the 2016 high could be on the horizon in 2020. The most direct route for a risk position in the silver market is via the coins and bars available through precious metals dealers around the world. The COMEX silver futures and futures options have a physical delivery mechanism. For those who do not venture into the physical or futures arena, the Velocity Shares 3X Long Silver ETN product provides an alternative. The fund summary for USLV states:
The investment seeks to replicate, net of expenses, three times the S&P GSCI Silver Index ER. The index comprises futures contracts on a single commodity. The fluctuations in the values of it are intended generally to correlate with changes in the price of silver in global markets.
Source: Yahoo Finance
USLV has net assets of $366.07 million, trades an average of 328,919 shares each day, and charges an expense ratio of 1.65%. The last rally in the silver futures market took the price from $17.28 on January 29 to $18.04 on January 30, a move of 4.4% to the upside.
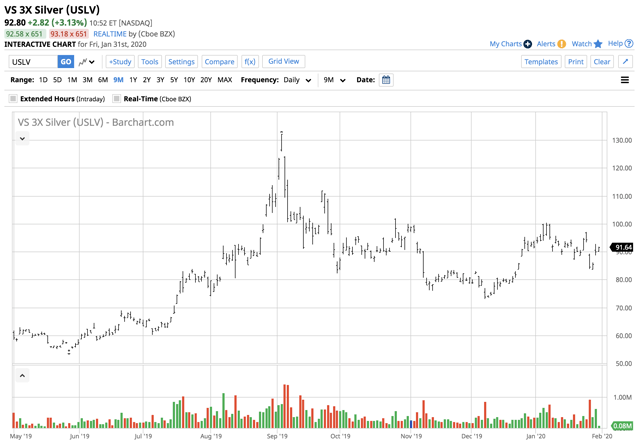
Source: Barchart
Over the same period, USLV rallied from $83.54 to $92.66 per share or 10.9%. USLV is a tool that is only appropriate for short-term risk positions on the long side of the silver market. If the price remains stable or moves lower, the gearing of USLV will cause its value to evaporate quickly. Triple leveraged products tend to experience periodic reverse splits.
Silver corrected sharply last Tuesday and Wednesday and recovered back to the $18 level by the end of the week. Over the past months, any selloff in the gold and silver market created a buying opportunity. I believe that silver will find a higher low and eventually challenge its long-term technical resistance level at just above $21 per ounce.
The Hecht Commodity Report is one of the most comprehensive commodities reports available today from the #2 ranked author in both commodities and precious metals. My weekly report covers the market movements of 20 different commodities and provides bullish, bearish and neutral calls; directional trading recommendations, and actionable ideas for traders. I just reworked the report to make it very actionable!
Disclosure: I/we have no positions in any stocks mentioned, and no plans to initiate any positions within the next 72 hours. I wrote this article myself, and it expresses my own opinions. I am not receiving compensation for it (other than from Seeking Alpha). I have no business relationship with any company whose stock is mentioned in this article.
Additional disclosure: The author always has positions in commodities markets in futures, options, ETF/ETN products, and commodity equities. These long and short positions tend to change on an intraday basis.
********
More from Silver Phoenix 500


