Silver At Critical Juncture


Silver has just kept tanking and tanking over the last couple of months. And taking my silver longs with it. It’s been painful stuff. That will teach me to trade against the trend. It’s certainly a different picture to all the hooting and hollering of the bulls back in June.
Silver is now back to just above its major yearly low of US$18.17 set in 2013. I often remark how the market likes to take things to the extreme and once again we have a clear case of that here. So, we are now at a critical juncture. If price were to break to new yearly lows now then price would likely capitulate. I just do not see this happening. Let’s investigate.
DAILY CHART
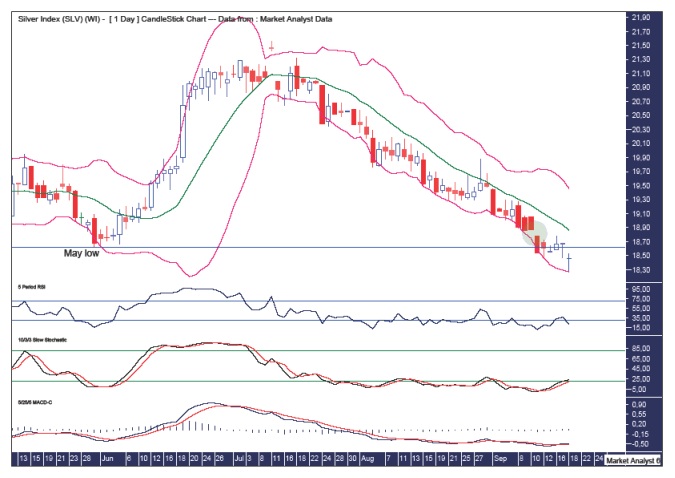
I have added a Relative Strength Indicator (RSI). In my last report I showed a double bottom with the trend setup on this indicator. That scenario was blown apart with the move down. That just shows price and pattern of trading is always more important than any indicator. Obvious really. Perhaps the pattern would have stood up if it was in the direction of the main trend. Anyway, the RSI subsequently made a new low reading of 11.33. Today price spiked down to $18.26 and looks to be accompanied by a bullish divergence.
A bullish divergence also looks to have occurred with the Stochastic indicator and the Moving Average Convergence Divergence (MACD) indicator. Both these indicators are also showing recent bullish crossovers. It’s not the first time but let’s hope it’s the last! For this move down anyway.
We can see price recently moved away from the lower Bollinger Band and today shot down to have another clip at it. Perhaps that is it?? I hope so.
I have drawn a horizontal line which represents the May 30 low at US$18.62. This recent move down has conveniently busted all the stops that were situated under this level. So the coast is clear, so to speak.
Also, today’s candle is a marginally positive doji. Not an uncommon sight to see at lows.
I have drawn a green highlighted circle which shows a recent gap. Taking out that gap will be a bullish sign. The gap is between US$18.78 and US$18.87.
WEEKLY CHART
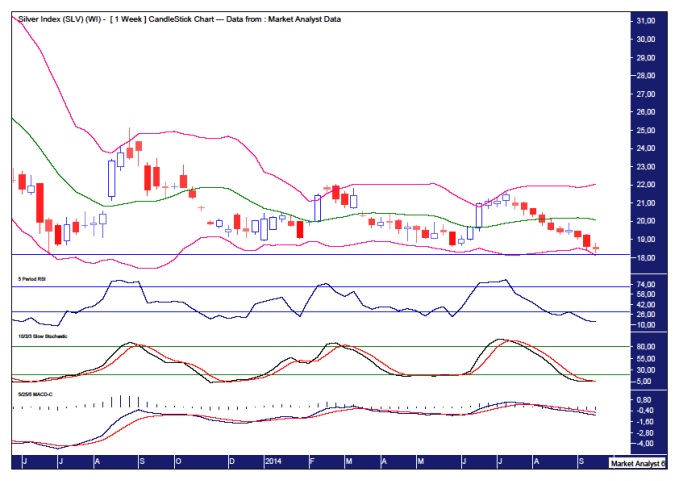
Both the RSI and Stochastic indicator are at oversold levels so a move up from here would not surprise. Not the be all and end all of course. The Stochastic looks to be threatening a bullish crossover.
The MACD is trending up nicely showing a pattern of higher lows and higher highs during this whole consolidation phase. That really should see price spring higher. Price turning up here will see yet another higher low form on this indicator.
The Bollinger Bands show price coming back down for a virtual hit on the lower band. I must admit, I didn’t think price would get this low but there you go.
I would like to see the weekly candle end in positive territory even if only marginally. That would then provide a good springboard for the belated explosion higher.
MONTHLY CHART
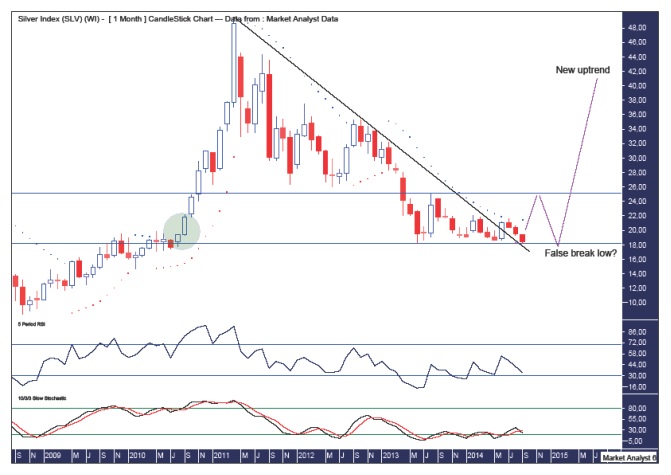
I have added a Parabolic Stop and Reverse (PSAR) indicator which I have been using for placing my stop orders. This level was at US$18.42. That price was busted today and resulted in my getting stopped out. I am viewing it as a fake out and being so close to the yearly low of $US$18.17, I decided to buy back most of my original long position and amend the stop orders to below the US$18.17 level. If the S.S Silver goes down below there now, then I’m going down with her!
Just as my line in the sand on this move down was the yearly low at US$18.17, my line in the sand to the upside is the high created after that yearly low at US$25.12. I have drawn a horizontal line at both these levels. And just as this move down has pushed it to the extremes falling around a half percent short, perhaps the move up will also push it to the extreme rising all the way to around US$25 before the final move to lows commences. Something to keep in mind.
I have drawn a green highlighted circle which is where price exploded higher going parabolic back in September 2010. Price really should not go much lower than this level. This is one reason why I really don’t favour price breaking to new yearly lows and capitulating as price would go much lower than this level.
I have drawn a trend line across tops from the all time high in 2011. The recent rally in June broke that trend line and there really should be some upside follow through. Breaking back below that trend line would be very bearish which would likely occur if price were to capitulate below US$18.17. I just don’t favour it.
The RSI and Stochastic indicator look to be trending up with higher highs and higher lows during this consolidation phase. Surely something has to give shortly.
Normally I don’t like to trade against the trend. Certainly, if price goes against me when I do trade against the trend, I am usually very quick to exit. That has not been the case here. Why? I still have a lot of confidence in my general outlook that there is one last big rally to come before the move lower to final lows. My general outlook calls for only a marginal false break low around $18, but only after a big rally now.
In my last report I stated I wasn’t worried one iota about my long silver positions. Well, byjingoes! Talk about opening my mouth too soon. However, the moment I get worried is often when a turn actually occurs. It is my very own personal Worry Index and it has finally turned bullish!!
********
My website is www.thevoodooanalyst.com
© 2014 Copyright The Voodoo Analyst - All Rights Reserved
Disclaimer: The above is a matter of opinion provided for general information purposes only and is not intended as investment advice. Information and analysis above are derived from sources and utilising methods believed to be reliable, but we cannot accept responsibility for any losses you may incur as a result of this analysis. Individuals should consult with their personal financial advisors. Put simply, it is JUST MY OPINION.


