Silver Flash In The Pan


No doubt, many people were excited on Thursday to see a spike in the silver price. The big news almost seemed like it would be a spike in the silver price. We were not quite so exuberant, tweeting:
“What happened to silver supply and demand fundamentals this morning?!”
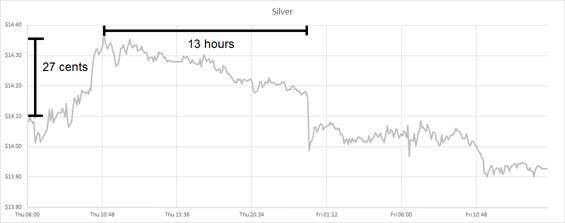
We expected it to be a teaser for today’s Report. However, the silver market took back the entire price move, and more, in about 13 hours. Here is a close-up, showing Thursday morning (Arizona time) through Friday around noon.
The Silver Price Spike
On a light note, last week we encouraged readers not to necessarily expect a price move just because we make or reiterate a price call. Our headline even mentioned Murphy’s Law. So it is of course that the price of gold jumped +$43 this week.
The price of silver gained only 9 cents, so the gold-silver ratio moved up sharply to over 79. Another call we have been making is for a rising ratio.
So what did happen in silver fundamentals on Thursday? Or indeed the whole week for both metals? Read on for the only true look at the supply and demand of gold and silver…
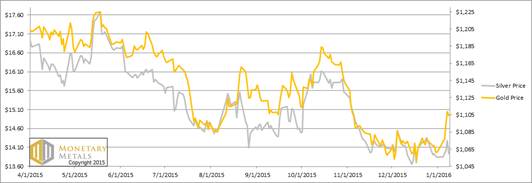
But first, here’s the graph of the metals’ prices.
The Prices of Gold and Silver
We are interested in the changing equilibrium created when some market participants are accumulating hoards and others are dishoarding. Of course, what makes it exciting is that speculators can (temporarily) exaggerate or fight against the trend. The speculators are often acting on rumors, technical analysis, or partial data about flows into or out of one corner of the market. That kind of information can’t tell them whether the globe, on net, is hoarding or dishoarding.
One could point out that gold does not, on net, go into or out of anything. Yes, that is true. But it can come out of hoards and into carry trades. That is what we study. The gold basis tells us about this dynamic.
Conventional techniques for analyzing supply and demand are inapplicable to gold and silver, because the monetary metals have such high inventories. In normal commodities, inventories divided by annual production (stocks to flows) can be measured in months. The world just does not keep much inventory in wheat or oil.
With gold and silver, stocks to flows is measured in decades. Every ounce of those massive stockpiles is potential supply. Everyone on the planet is potential demand. At the right price, and under the right conditions. Looking at incremental changes in mine output or electronic manufacturing is not helpful to predict the future prices of the metals. For an introduction and guide to our concepts and theory, click here.
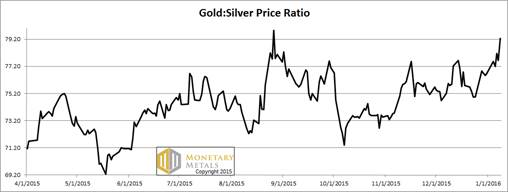
Next, this is a graph of the gold price measured in silver, otherwise known as the gold to silver ratio. The ratio jumped up this week.
The Ratio of the Gold Price to the Silver Price
For each metal, we will look at a graph of the basis and cobasis overlaid with the price of the dollar in terms of the respective metal. It will make it easier to provide brief commentary. The dollar will be represented in green, the basis in blue and cobasis in red.
Here is the gold graph.
The Gold Basis and Cobasis and the Dollar Price
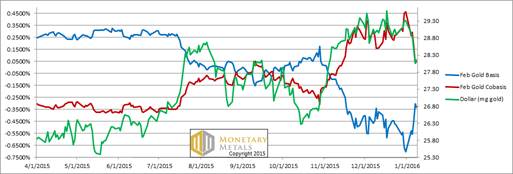
The tracking between the red and green lines is uncanny! Red is our scarcity indicator. Green is the price of the dollar in gold (which is the inverse of the price of gold in dollars). So what does this mean?
It means the more that the dollar goes down (i.e. the price of gold goes up), the less scarce gold becomes in the market. Higher prices are discouraging buyers and encouraging sellers. And by buyers and sellers here, we mean of metal.
This is normal, though not especially a sign of an imminent skyrocketing of the gold price.
Our calculated fundamental price of gold is up about ten bucks this week. In other words, it’s stable even in the face of a significant price move. Also normal (assuming it’s a reasonable indicator). The fundamental is over $150 above the market.
Now let’s look at silver.
The Silver Basis and Cobasis and the Dollar Price
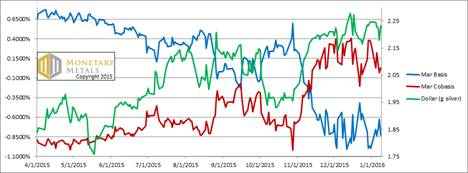
It should be immediately apparent that conditions in the silver are different. Despite a strong dollar (i.e. low price of silver, measured in dollars) silver became a bit less scarce.
We don’t show a close-up of the silver basis and cobasis around the move on Thu-Fri. But we can just say that the price move was accompanied by the opposite cobasis move. It was speculators trying to front-run the market, and ending up only front-running themselves.
The fundamental price for silver fell again this week, though by less than a dime. We consider silver to be within the margin of error from its fair price at the moment.
This means the fundamental price of the gold-silver ratio went up again. We will look at this in more depth, in our Outlook 2016. Stay tuned!
© 2016 Monetary Metals
 Dr. Keith Weiner is the CEO of Monetary Metals and the president of the Gold Standard Institute USA. Keith is a leading authority in the areas of gold, money, and credit and has made important contributions to the development of trading techniques founded upon the analysis of bid-ask spreads. Keith is a sought after speaker and regularly writes on economics. He is an Objectivist, and has his PhD from the New Austrian School of Economics. His website is www.monetary-metals.com.
More from Silver Phoenix 500