Silver Forecast: $50 Then Much Higher


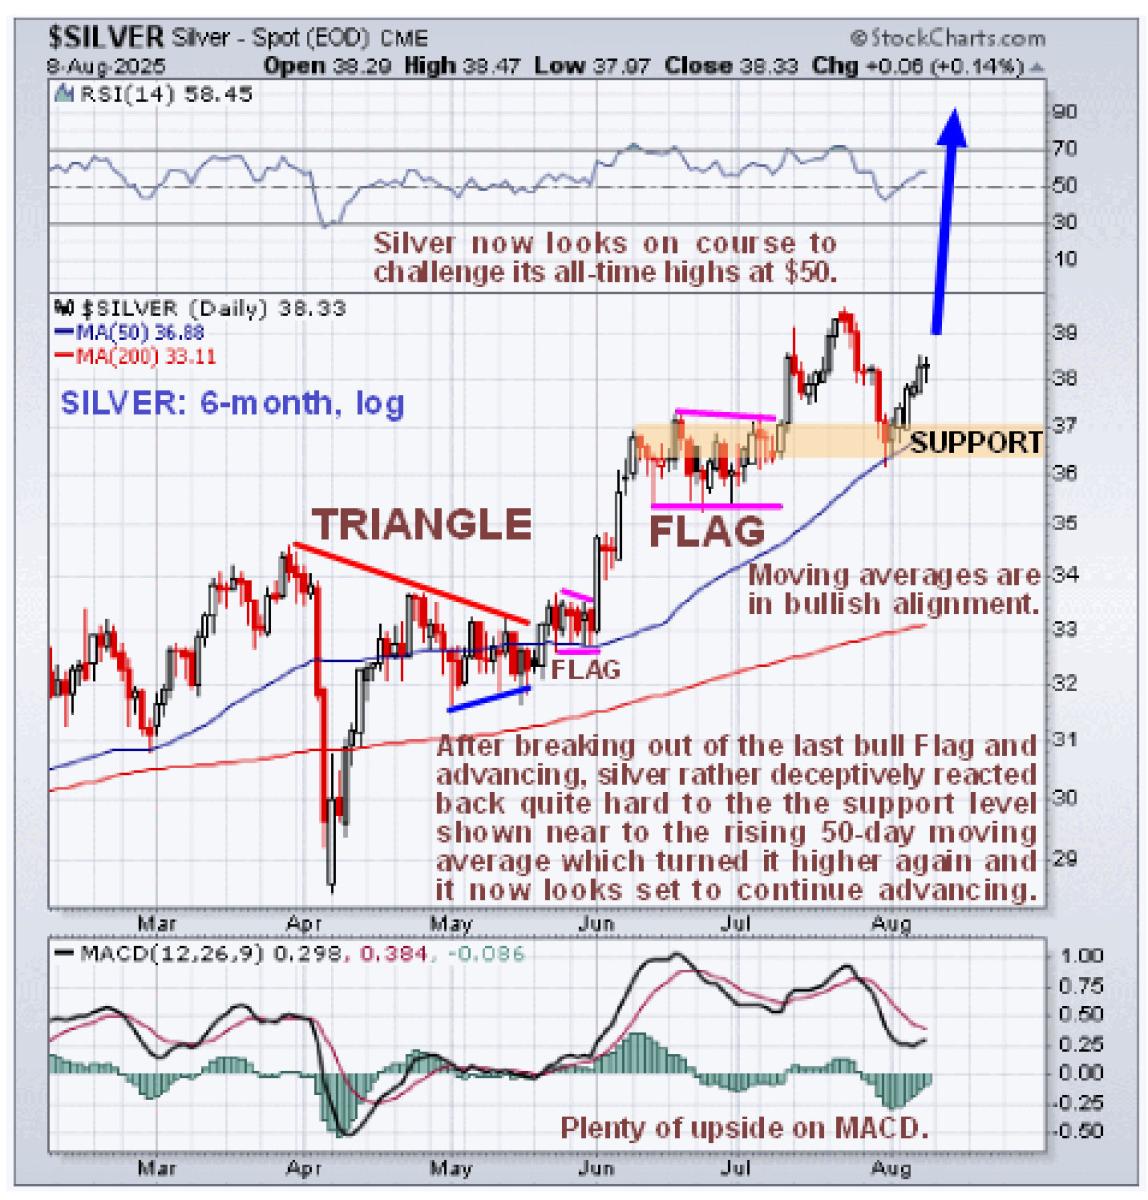
We got the upside breakout from the bull Flag that was predicted in the last update posted on July 6th but then rather like Apollo 12 which got struck by lightning twice in quick succession on the way up, the ride got bumpy for a while with it reacting back quite sharply to support within the Flag and at the rising 50-day moving average, but then it stabilized and started higher again last week as we can see on the latest 6-month chart below and it is worth noting that the rather unexpectedly large reaction brought the MACD back to a very modest reading, which means that upside potential has been almost fully restored and given the overall strongly bullish tenor of this chart, silver has big upside potential from here.
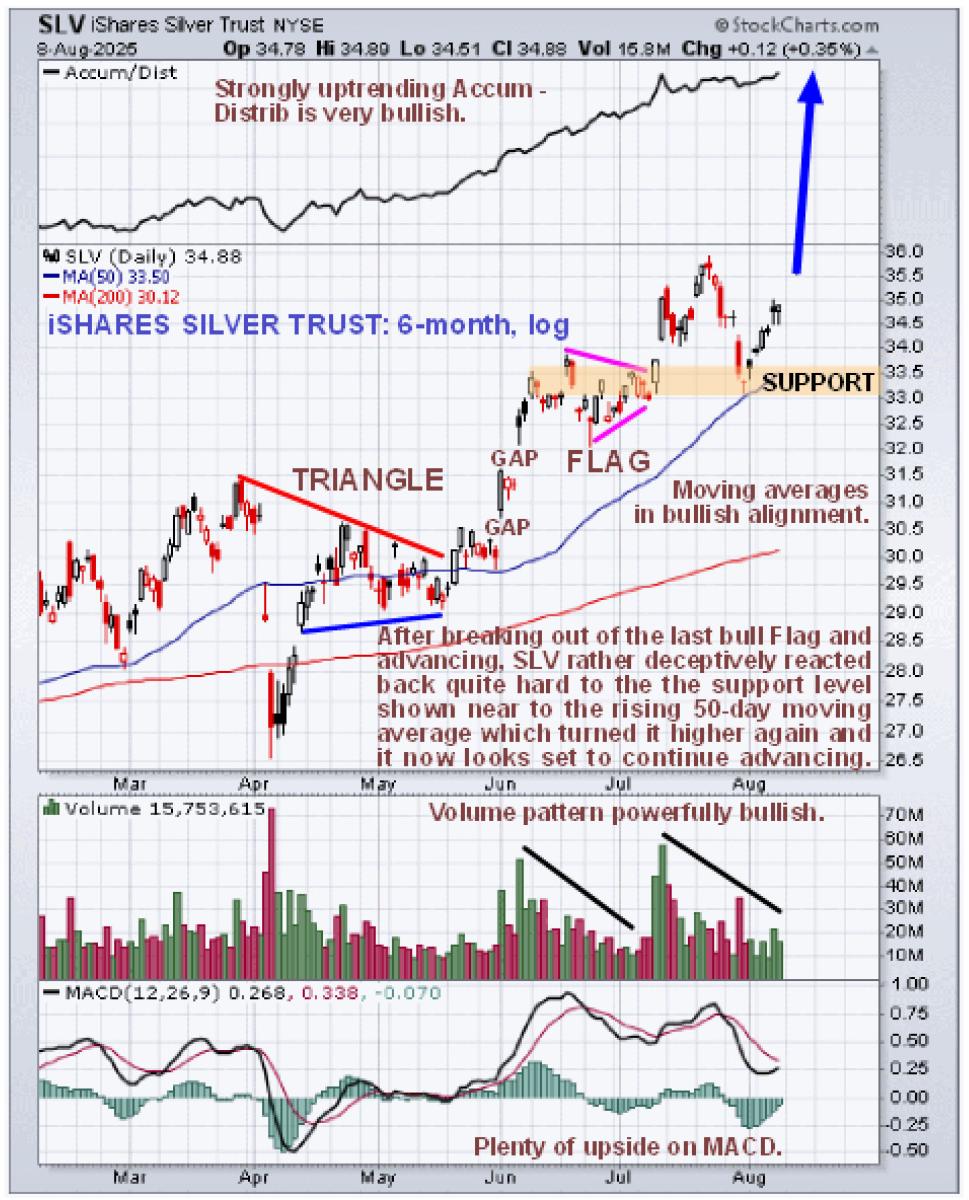
We are somewhat hampered looking at the silver chart in Stockwatch because volume and volume indicators are not available, but we can easily get around this obstacle by looking at the chart for iShares Silver Trust, which is a reliable proxy for silver itself. Thus, on the 6-month chart for SLV we see that the volume pattern is strongly bullish, with big volume on rallies that dies back on the reactions that follow which is why the Accumulation line shown at the top of the chart is trending strongly higher and the fact that it is already making new highs is certainly a propitious indication that points to a strong advance whose first target will be the 2011 all-time highs at $50 that, once cleared, can be expected to lead to rapid upside acceleration.
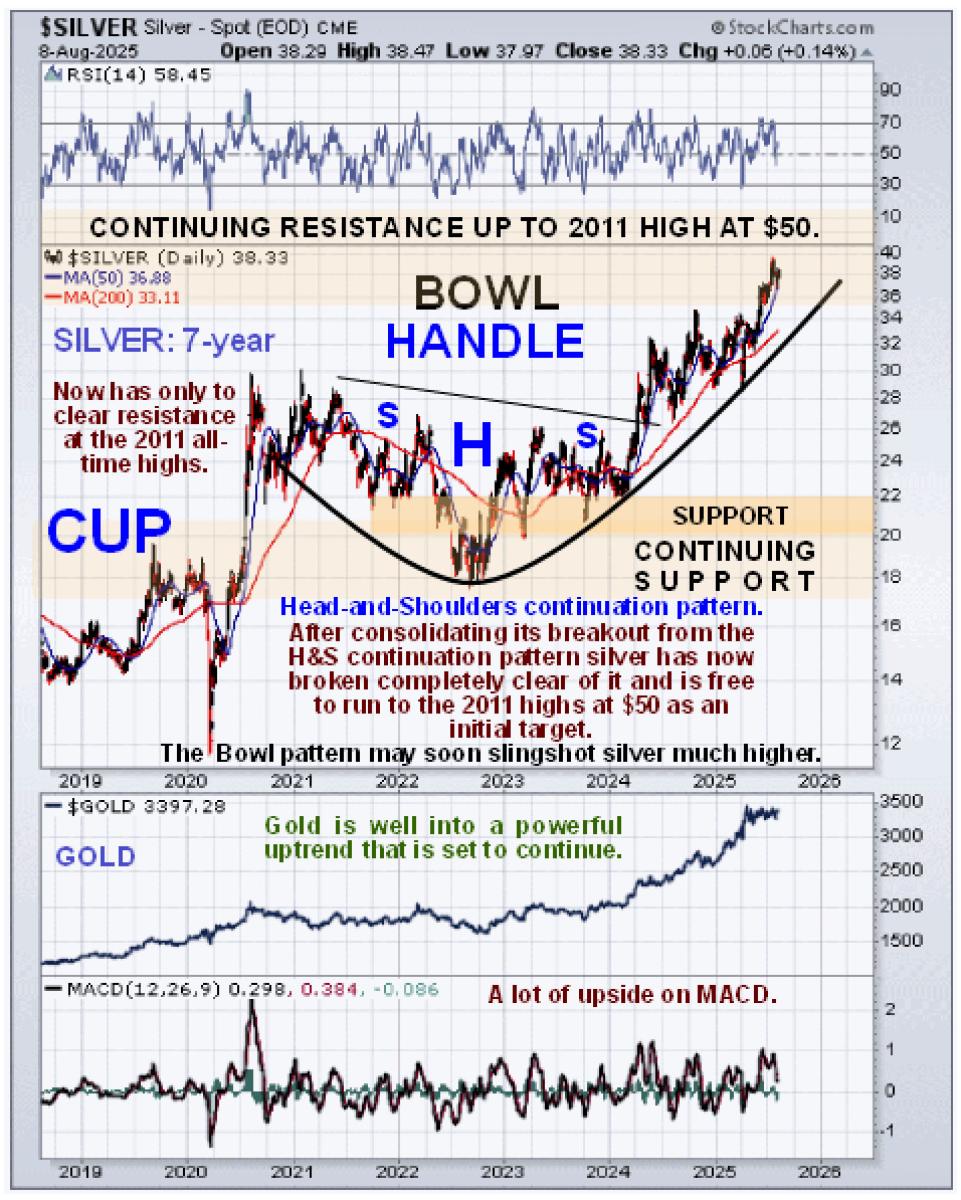
Zooming out via the 7-year chart we see that the major bull market in silver is now becoming established and is poised to accelerate with the price now advancing away from the giant Head-and-Shoulders continuation pattern that formed following the 2020 and 2021 highs, with the price also being projected higher at an accelerating rate by the boundary of the giant Bowl pattern shown that is shepherding the price ever more rapidly towards a breakout above the resistance approaching and at the 2011 highs at $50.
The next two paragraphs are the same as in the last update because they have the same relevance…
On the long-term chart going back to the start of the millenium, i.e. to the start of 2000, we can see the origins of the resistance that silver is currently working its way through, which is the top that formed in 2011 – 2012. Once it breaks clear above the high point of this, which is at $50, it will be in new high ground and free to accelerate away to the upside.

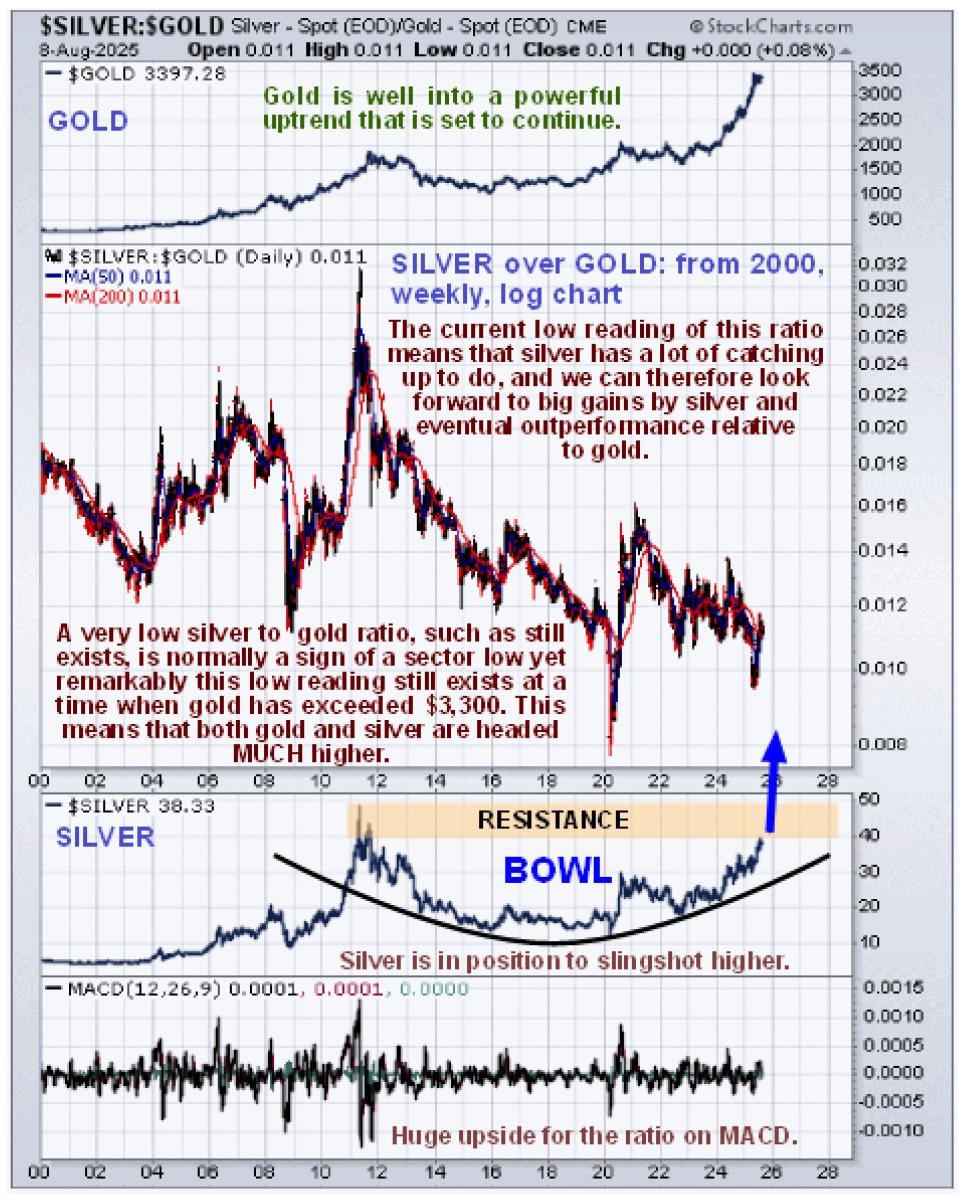
Lastly, it’s worth taking a look at the silver over gold ratio chart for the same time period, from 2000, which shows that despite gold’s big gains from early last year, this ratio is still at a very low level, which means that this sector bull market has much further to go. This sort of low reading means that there remains very little retail interest in the sector – this is very bullish for the sector and for silver in particular which is regarded as a “steal” at these prices. The rationale behind interpreting this chart is this; when there is a lot of speculative interest in the PM sector, investors favor silver over gold, because it has the capacity to make bigger percentage gains faster – this is what we saw when the sector peaked in 2011 with silver hitting $50 in the late Spring of that year and gold topping out later in the year in September which is why the silver over gold ratio hit a peak. When, on the other hand, the silver over gold ratio is at a low level it means that speculative interest in the sector is at a low ebb, investors have no interest in it, which is very bullish as it means that there is the potential for it to go much higher. This is what we saw at the ratio lows in 2003 before the sector headed much higher, at the lows of the 2008 broad market crash which dragged the PMs down with it and at the time of the Covid Crash in the Spring of 2020 when we saw a freak low due to the orchestrated mass psychosis that existed at that time.
Finally, an important point to make in closing is that the “window of opportunity” to buy silver and silver related investments before the big breakout above $50 that is expected to lead to potentially dramatic acceleration is believed to be rapidly closing up as a breakout above $50 is looking increasingly likely soon.
*********


