Silver, Impact Scope


As a trader, you can occupy your mind with a lot of data and create scenarios for each different event. This will create an unmanageable workflow plan since anything, and everything can move the markets. A more principle-based approach is grouping all events into their impact scope. So instead of creating individual insurance policies for fire, flood, storm, earth quick, and so forth, you’d rather have one umbrella insurance based on impact only. Meaning, make your risk decisions in trading only based on the scope of the impact, irrespective of the cause. This simplifies your toolbox on how to react to extraordinary events and prepares you in a way that your mind isn’t overwhelmed with too much evaluation of various scenarios. Silver, impact scope.
The markets are a game already with too many variables that overwhelm the left-brained market participant. Cornering risk, the most important component in market play, through reducing impact criteria is useful. When working with charts, we deal with three major aspects:
-
price
-
volume
-
time
From these components, we derive trend, range, volatility, and other subgroups of impacting nuances.
In effect, the only worthwhile question to be asking is: “Do we have a low-risk trade that is worthwhile taking”?
Silver, Weekly Chart, Silver-impact scope, Price:
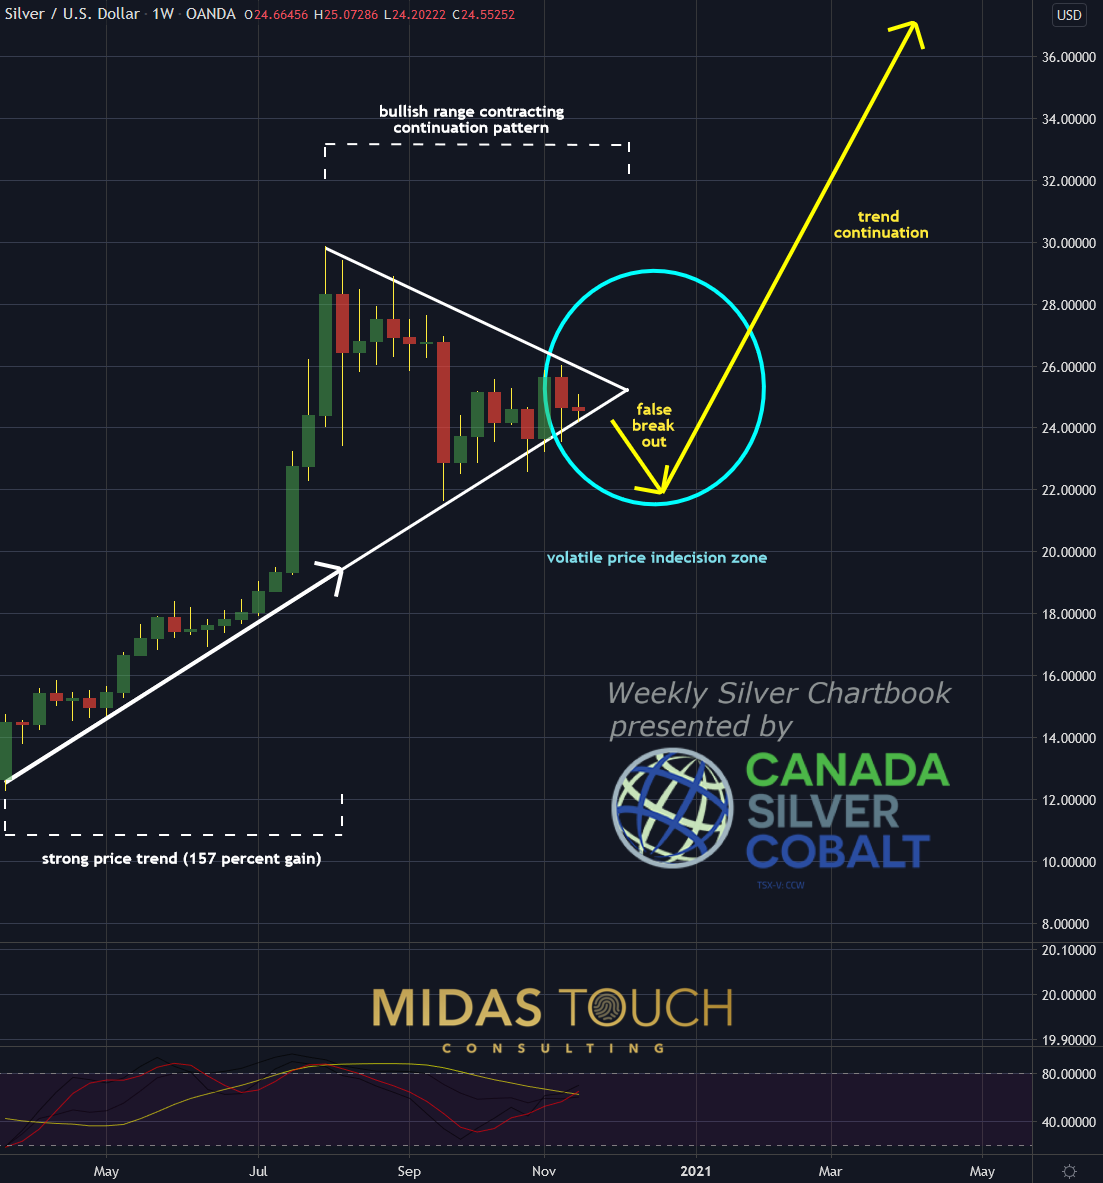
Silver in US Dollar, weekly chart as of November 18th, 2020
Over the last six months, the price of Silver has been bullish. The weekly chart above describes our most likely scenario of the future for Silvers price behavior.
Silver, Monthly Chart, Volume:
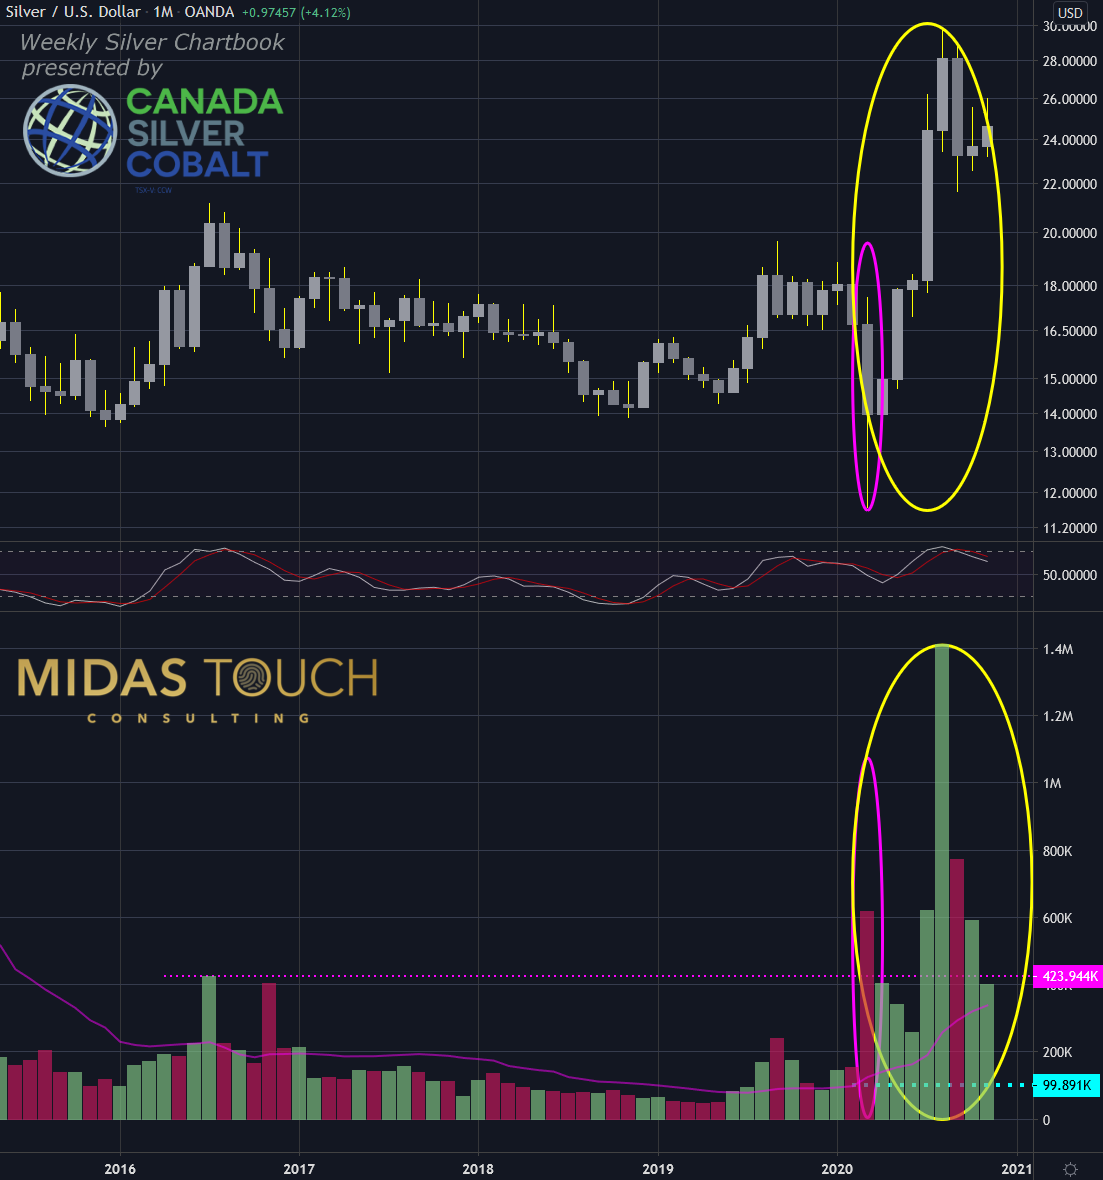
Silver in US Dollar, monthly chart as of November 18th, 2020
On the monthly time frame, the volume analysis of the Silver market shows a six hundred percent increase from the twenty-day moving average volume (99.89k) in March of this year. It confirms the reversal price pattern (purple circles).
The following month’s volume node (yellow circle) exceeded a temporary high (424k) of the last five years by more than threefold. This confirms the larger turning point from a sideways market into a bullish directional market.
Silver, Monthly Chart, Time:
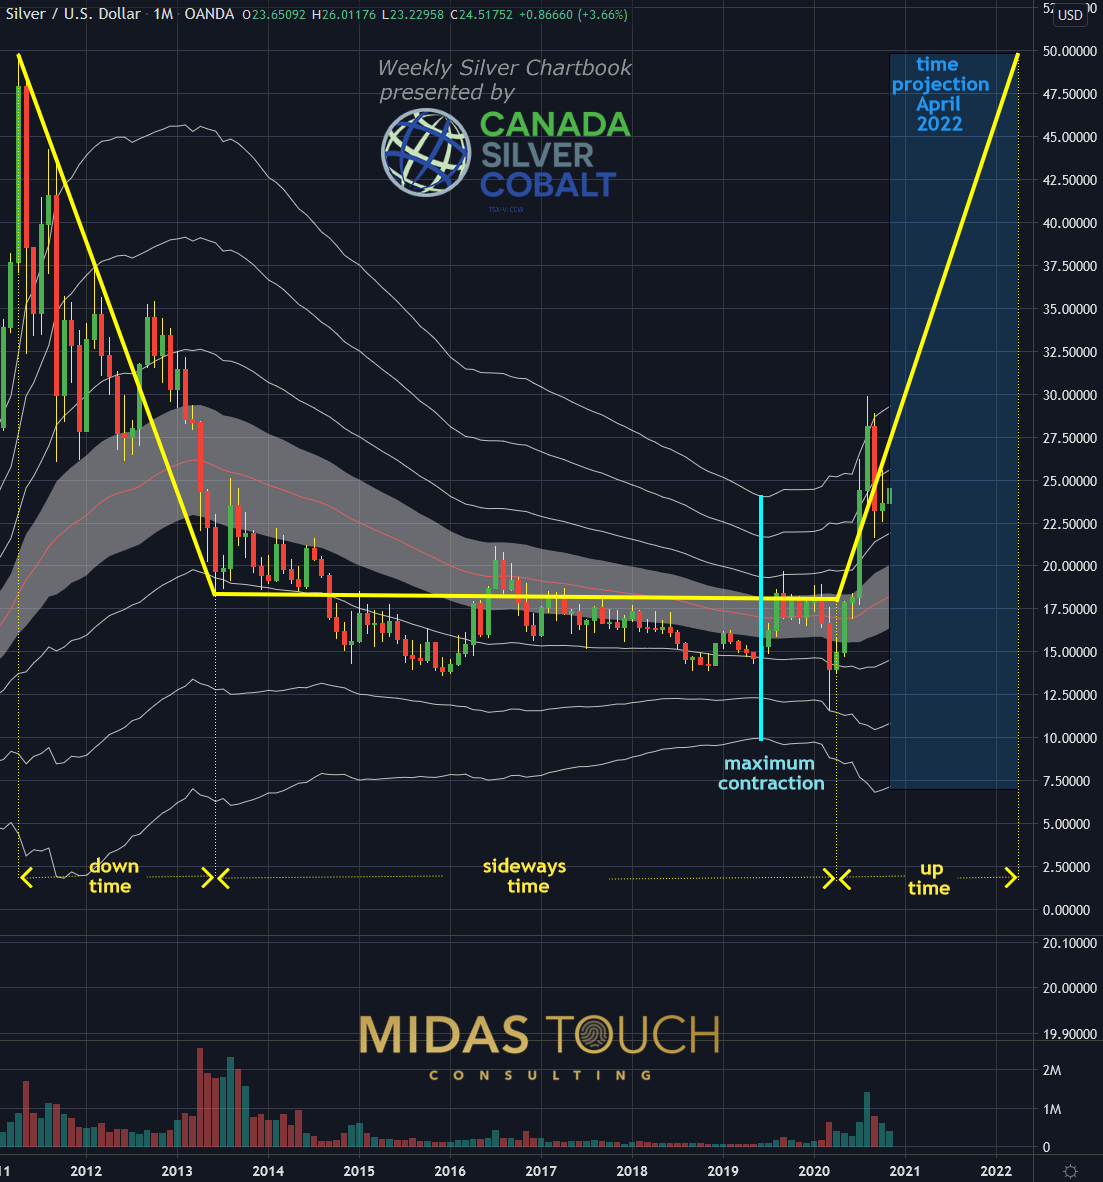
Silver in US Dollar, monthly chart as of November 18th, 2020 b
Looking at the market from a time perspective, we project a doubling in price within seventeen months. The standard deviation model contraction maximum was in June this year. In other words, this confirms that Silver is in an expansion cycle right now.
Silver, impact scope
We can’t stretch enough how valuable a free mind in trading is. Debate and any other unresolved questionnaire in one’s mind are counterproductive for executing trades. Reducing data by grouping it in the impact fields of:
-
How will this affect the price?
-
How might this affect volume?
-
What time frame are we talking about?
It can at times of action substantiate a solid course of action. Postponing reason, causes, and details to a later time reduces trading errors by a large margin.
We post real time entries and exits for the silver market in our free Telegram channel.
If you like to get regular updates on our gold model, precious metals and cryptocurrencies you can subscribe to our free newsletter.
*********

Outstanding abstract reasoning ability and ability to think creatively and originally has led over the last 25 years to extract new principles and a unique way to view the markets resulting in a multitude of various time frame systems, generating high hit rates and outstanding risk reward ratios. Over 20 years of coaching traders with heart & passion, assessing complex situations, troubleshoot and solve problems principle based has led to experience and a professional history of success. Skilled natural teacher and exceptional developer of talent.Avid learner guided by a plan with ability to suppress ego and empower students to share ideas and best practices and to apply principle-based technical/conceptual knowledge to maximize efficiency. 25+ year execution experience (50.000+ trades executed) Trading multiple personal accounts (long and short-and combinations of the two). Amazing market feel complementing mechanical systems discipline for precise and extreme low risk entries while objectively seeing the whole picture. Ability to notice and separate emotional responses from the decision-making process and to stand outside oneself and one’s concerns about images in order to function in terms of larger objectives. Developed exit strategies that compensate both for maximizing profits and psychological ease to allow for continuous flow throughout the whole trading day. In depth knowledge of money management strategies with the experience of multiple 6 sigma events in various markets (futures, stocks, commodities, currencies, bonds) embedded in extreme low risk statistical probability models with smooth equity curves and extensive risk management as well as extensive disaster risk allow for my natural capacity for risk-taking.
More from Silver Phoenix 500


