Silver Investors: Why The Next Financial Crisis Will Be Different


 There's a lot of analysis on the MSM and alternative precious metal sites forecasting how the future events will play out. Unfortunately, 99% of MSM -Mainstream media’s take on the future is absolutely worthless. However, many precious metal analysts are also making incorrect financial and economic forecasts, based on faulty assumptions of the future.
Now, don’t get me wrong… I still have a great deal of respect for the majority of precious metal analysts as they all believe that gold and silver are the best investments (stores of value) to own when the next financial calamity arrives. I just happen to differ with some of these analysts due to their incomplete understanding of how energy will impact the precious metals, mining and overall economy going forward. Basically, we both agree the value of gold and silver will explode in the future, but for different reasons.
The next financial crisis to hit the US and world will be much different from anything we have experienced before. This is due to the massive amount of Debt and Leverage versus the remaining available cheap energy reserves to generate the economic activity to pay it off.
Thus, the GREAT FINANCIAL ENEMA is coming whether we like it or not.
While I realize many folks (even many of my readers) don’t believe there is an upcoming energy crisis, I am not going to get into the details in this article. My stance on this is… Either you believe it now, or just wait a few years until the reality of peak oil and the falling EROI (Energy Returned On Invested) become a forgone conclusion.
I have to say, it’s amazing the amount of emails I receive explaining to me that “ENERGY IS NOT A PROBLEM”, it’s the elite… the Powers that be. While I realize certain folks are pulling strings from way up above, Peak oil and the Falling EROI will cause a great deal of havoc for those with more money than sense. Mark my words.
Okay, enough of that rant. Let’s get to some REAL DATA.
Surging U.S. & India Silver Imports Signalling A Financial Crisis?
It’s truly amazing just how much silver India and the United States are on track to import in 2015. Even though these figures and this subject matter have been discussed at length on many precious metal sites, until we look at the data as shown below, you can’t really comprehend just how much it is:
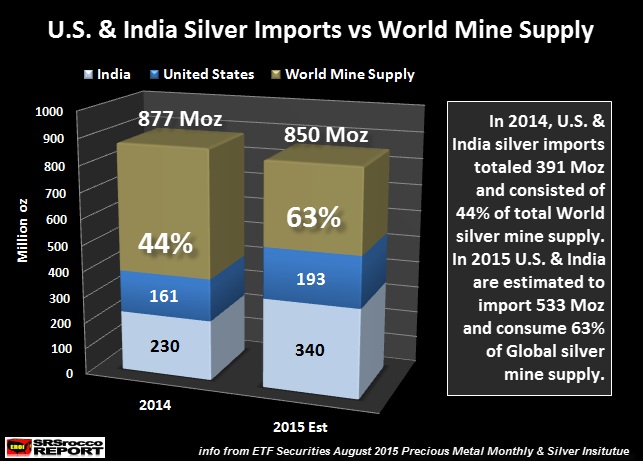
As we can see, total U.S. and Indian silver imports of 391 million oz (Moz) comprised 44% of the total 877 Moz of global mine supply in 2014. However, total silver imports from these two countries are estimated to reach a staggering 533 Moz and consume 63% of total world silver mine supply. Which means, U.S. and India estimated total silver imports in 2015 will absorb nearly 20% more of total mine supply compared to last year.
You will notice that world mine supply is estimated to be 850 Moz in 2015 versus 877 Moz last year. This is based on falling production from Mexico, Australia, Chile and Canada. More on this in future articles. However, I can tell you that Australia’s silver production is down a whopping 30% in the first six months compared to the same period last year.
So, with falling global silver mine supply on top of declining silver scrap supply, this huge increase of U.S. and Indian silver demand is putting increased stress on the wholesale silver market. And why is India on track to import a massive 340 Moz in 2015 compared to 230 Moz last year? Some say it’s due to their ramp up of solar panel manufacturing. While this may be true to some degree, silver consumption in the world solar industry has only increased marginally over the past few years.
This leads me to believe, Indians are stockpiling silver because they realize a GOOD DEAL when they see it. And silver at $14-$15 is a good deal as it’s below the break-even cost of the majority of primary silver producers regardless of the lousy “Cash Cost Analysis” that continues to be used by official sources today.
For example, ETF Securities put out their August Precious Metal Monthly and stated the following as it pertained to silver production costs:
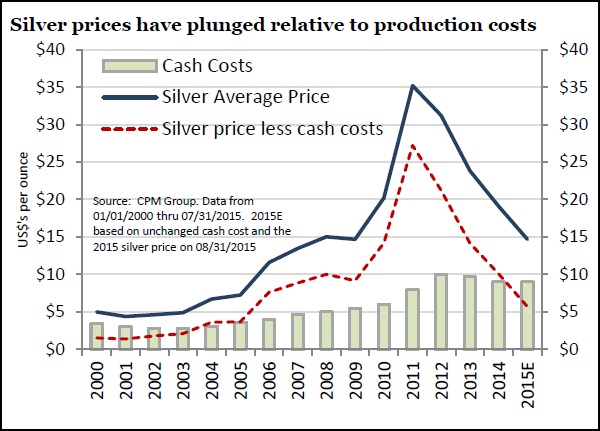
Silver is at the lowest level over production costs in 10 years. Silver ended August at its lowest price over average cash costs since 2005 (based on data from the CPM group). Silver cash costs (the basic costs of production per unit of output on site) are likely running just under US$9/oz. in 2015, the price of silver ended August less than $6/oz. over the basic cash costs. The year 2005 marked the last time the price of silver sustained a lower price over cash costs, at about US$4/0z. Such a narrow spread over basic cash costs indicates a majority of miners are likely unprofitable which is thus unsustainable in the long term. Some analysts expect total silver supply to contract in 2015 on the back of slowing mine supply growth and a continued sharp contraction in recycling scrap supply.
Now, ETF Securities puts out some excellent data, but their regurgitation of the worthless cash cost metric continues to confuse investors as to the real cost to mine silver. What makes matters worse, is that they quote the CPM Group which is run by Jeff Christian. Jeff tends to talk out of both sides of his mouth when it comes to investing in silver.
Regardless, the important takeaway in understanding why CASH COSTS are totally meaningless, is that they deduct by-product credits from the cost of mining silver. According to my research in my top 12 primary silver miners in 2014, their total by-product credits and primary gold revenue accounted for 44% of their revenue. If a company is allowed to deduct their by-product credits (revenues) to show a low cash cost, it does nothing to determine the profitability of the company.
Furthermore, my top 12 primary silver miners suffered a total adjusted net loss of $77 million in 2014. Their by-product credits and gold revenue was $1.5 billion. If we were to remove say $300 million of estimated gold revenue, it would leave $1.2 billion in by-product credits. Go ahead and deduct their $1.2 billion of by-product revenue from the total revenue of $3.4 billion in 2014…. and tell me how AWFUL their losses would have been. LOL
This is the insanity of the analysts community. They continue to use a useless metric which intentionally misleads investors into believing the cost to produce silver is lower than it actually is.
Peak U.S. Shale Oil Production: The Canary In the Coal Mine
The U.S. Energy Information Agency (EIA) just released their September Drilling Productivity Report, stating shale oil production peaked in April 2015. Please hit on the link and check out the data for yourself. I took their excel spreadsheet and made the chart below:
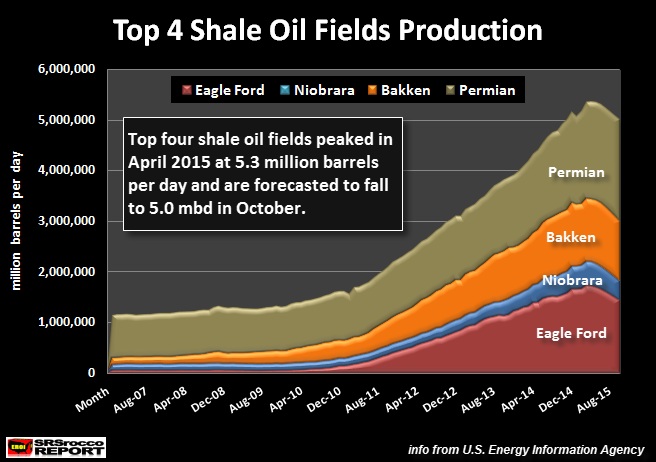
These are the top four shale oil fields in the United States. While the Permian (olive-green color) has shale wells, half of its oil production comes from conventional (more profitable) wells. As we can see, production from these four shale oil fields peaked in April at 5.35 million barrels per day (mbd) and are forecasted to fall to 5.0 mbd in October.
NOTE: The Drilling Productivity Reports are based in estimates.
Now that the price of oil is down in the $40-$45 range, I would imagine we will see a more serious decline of U.S. shale oil production by the end of 2015 and into 2016. That being said, the EIA just released data showing total U.S. domestic oil production is down 500,000 barrels per day (bd) at 9.1 mbd currently from the peak of 9.6 mbd months ago.
To put the past and future U.S. oil production into perspective, we need to look at the chart below:
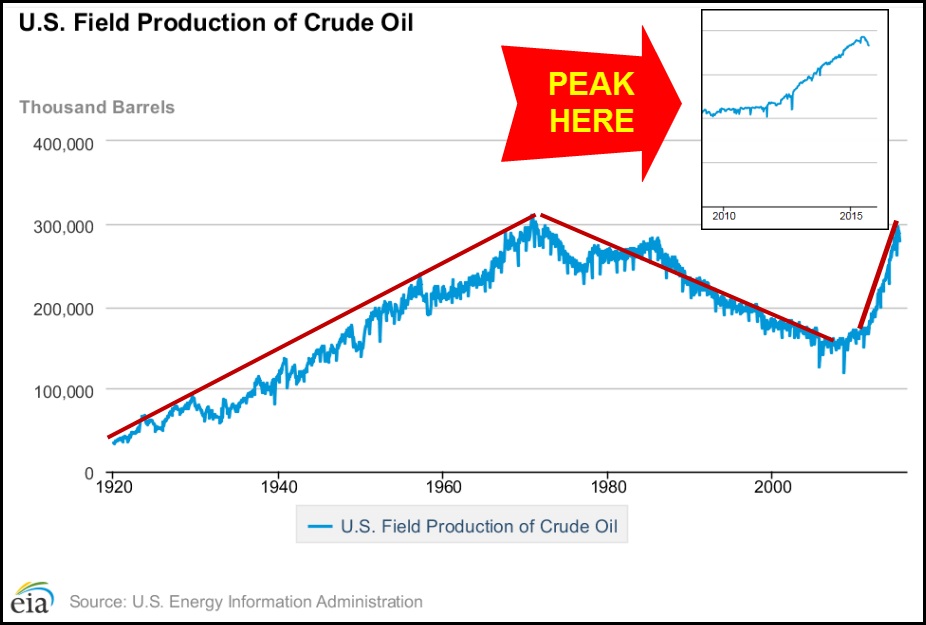
This main chart shows U.S. oil production since 1920. I added the RED LINES to show the rate of increase and decrease. You will notice that the upside from 1920 to 1970 and downside from 1970 to 2005 were symmetrical. Of course, it wasn’t exact… but pretty darn close.
Now, look at the recent upside from shale oil production 2007 to present. It’s nearly exponential. What would a betting individual guess as to how the DOWNSIDE of the present peak will look like? Aye? I included the smaller chart insert above to show that production has indeed peaked.
For all the dreamers who believe the U.S. has all this cheap untapped oil, I know some folks who would like to sell you plenty of U.S. Treasuries and Interest Rate Swap Derivatives.
According to some of the better energy analysts I follow, U.S. oil production will likely decline 33% by 2020 and 60-70% by 2025. How will the U.S. function on that amount of oil? Furthermore, include the fact that oil imports will be lower due to the inability in the future for the U.S. to exchange oil for worthless Dollars or Treasuries.
The fall of U.S. shale oil production is the Global Canary in the coal mine.
Better Hold Physical Gold & Silver Before The Next Financial Crisis Hits
The next financial crisis will be nothing like mankind has never experienced before. Why? Because the amount of debt and leverage in the financial system on top of falling global energy supply, will totally destroy the valuation of most paper and physical assets.
Investors who assumed Real Estate is a good place to park their wealth, will find out it will be one of the worst physical assets to own going forward. Only certain types of real estate in certain areas will hold some value compared to most Suburban-City Residential, Industrial and Commercial Real Estate that will continue to plummet for decades.
Again… this next financial collapse will be different from anything we experienced before. Which is why it is wise to own physical gold and silver. Thus, gold and silver will be some of the safest assets to own when the Fed finally runs out of Silver Bullets.
————————————–
Please check back for new articles and updates at the SRSrocco Report. You can also follow us at Twitter below:


