Silver Leads Gold In Rate Hike Cycle


Since Chinese New Year buying peaked in February, gold has essentially traded sideways with a mild upside bias. Here’s why:
Indian dealers are waiting for the government to announce the GST rate for gold, and it’s too early for them to begin stocking up for Diwali.
So, the price discovery ball is now in the US central bank’s court. I’ll dare to suggest that most gold market investors don’t fully understand the relationship between interest rates, money velocity, and gold.
Gold rises when events create or signify rising risk, regardless of what those events are. Sometimes a decline in interest rates increases risk, and sometimes a rise in rates increases risk.
In the current environment, rising rates increase the odds that banks will lend money so aggressively that inflation rises much faster than interest rates.
Interest rates are incredibly low from a historical perspective, so gold investors who are inflation enthusiasts need to exercise patience. It takes time for rates to rise enough for banks to become aggressive (and perhaps reckless) with lending policy.
In the current hiking cycle, there have been three rate hikes. As I predicted, each hike has been followed by a superb rally in the price of gold.
The good news is that the next major Fed rate hike announcement should happen on June 14, which is now only about three weeks away.
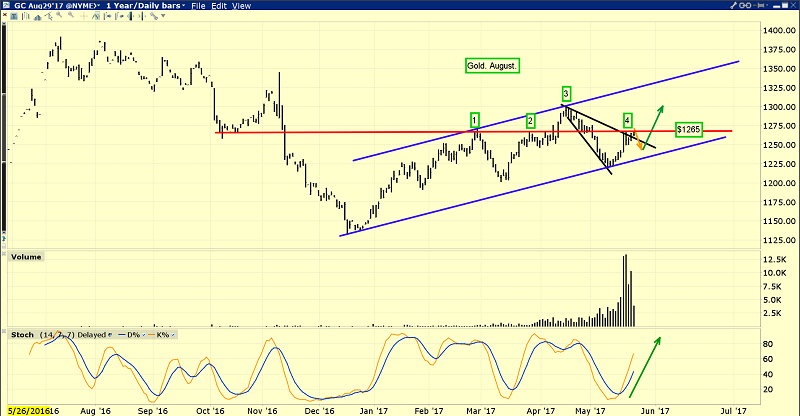
This is the daily gold chart.
From a technical standpoint, the $1265 resistance zone has halted most of the recent gold rallies, but the overall price action feels very firm. Gold investors should feel strong and confident.
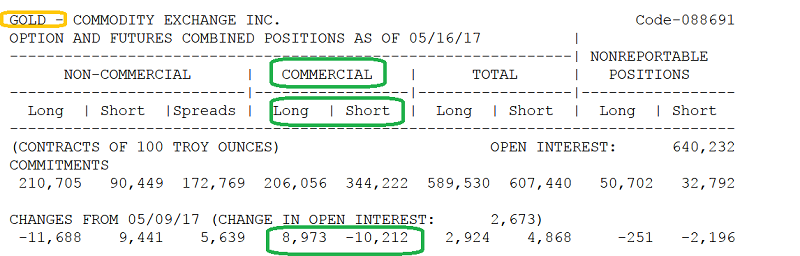
This is the COT report for gold.
It’s clear that the “smart money” commercial traders have a positive outlook; they are covering lots of short positions and adding a decent number of longs.
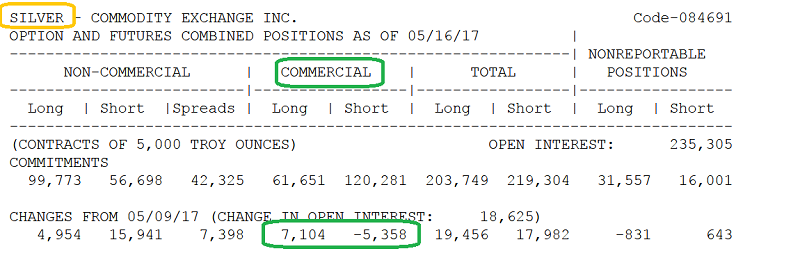
The COT report for silver is also very positive. The commercial traders are solid buyers and they are also covering short positions.
These COT reports should add more confidence to the average metals market investor’s belief that a post Fed rate hike rally could be a very big one!
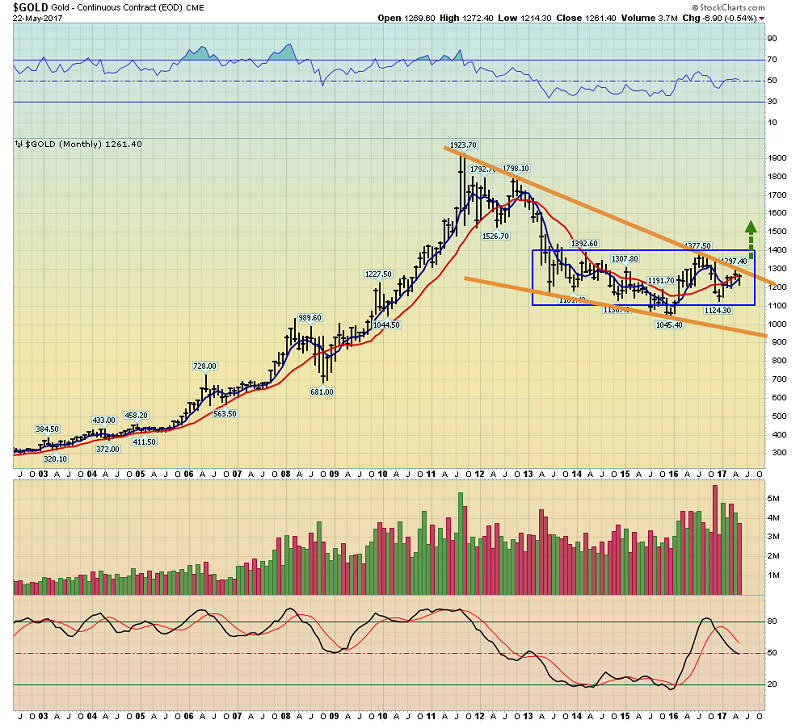
This is the long term weekly gold chart.
A breakout above $1265 should occur after the June rate hike, and the rally following that breakout should take gold above the downtrend line that I’ve drawn from the $1923 area high.
In the big picture, gold has traded sideways in a large rectangular pattern for almost four years. The rough trading range of that pattern is $1100 to $1400.
In my professional opinion, the sideways action is coming to an end… both technically and fundamentally.
The target of an upside breakout from the large rectangular pattern is the $1600+ area. That is good news for a lot of gold and silver mining companies.
Most gold miners have costs below the current price of gold, but an extra cushion of $200 an ounce should turn them into a herd of cash cows.
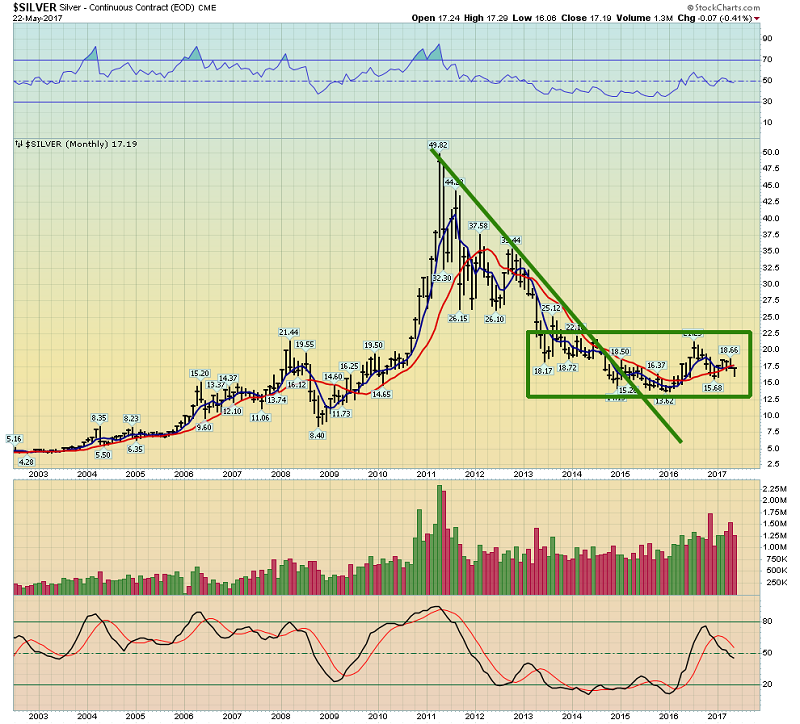
This is the long term silver chart. Silver broke above its downtrend line back in 2015. That breakout suggests something similar is coming in gold.
If it’s accompanied by an uptick in money velocity, gold and silver stocks could shock most investors with a nice move higher.
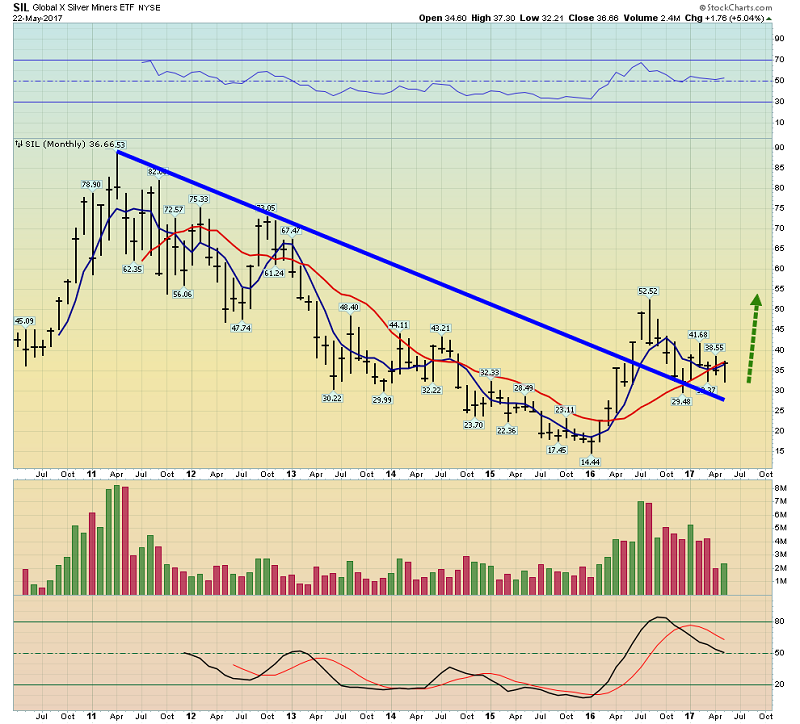
This SIL silver stocks ETF chart has also broken above its downtrend line. It’s trading well above the 2016 lows, and is poised to make silver stock enthusiasts very happy, very soon.
On a technical level, silver has a general tendency to lead gold. On a fundamental level, it is the rise in interest rates (both current and prospective) that should reverse money velocity. That will change the technical charts from their current sideways price action to rally mode. Odds are growing that this happens at the same time as Indian dealers begin stocking for Diwali, adding some serious “juice” to the rally!
********
Special Offer For Gold-Eagle Readers: Please send me an Email to freereports4@gracelandupdates.com and I’ll send you my free “American Mining Muscle!” report. I highlight six key gold and silver stocks operating on American soil that are poised to make their stockholders great!
Note: We are privacy oriented. We accept cheques, credit card, and if needed, PayPal.
https://www.gracelandupdates.com
Email:
Rate Sheet (us funds):
Lifetime: $999
2yr: $299 (over 500 issues)
1yr: $199 (over 250 issues)
6 mths: $129 (over 125 issues)
To pay by credit card/paypal, please click this link:
https://gracelandupdates.com/subscribe-pp/
To pay by cheque, make cheque payable to “Stewart Thomson”
Mail to:
Stewart Thomson / 1276 Lakeview Drive / Oakville, Ontario L6H 2M8 Canada
Stewart Thomson is a retired Merrill Lynch broker. Stewart writes the Graceland Updates daily between 4am-7am. They are sent out around 8am-9am. The newsletter is attractively priced and the format is a unique numbered point form. Giving clarity of each point and saving valuable reading time.
Risks, Disclaimers, Legal
Stewart Thomson is no longer an investment advisor. The information provided by Stewart and Graceland Updates is for general information purposes only. Before taking any action on any investment, it is imperative that you consult with multiple properly licensed, experienced and qualified investment advisors and get numerous opinions before taking any action. Your minimum risk on any investment in the world is: 100% loss of all your money. You may be taking or preparing to take leveraged positions in investments and not know it, exposing yourself to unlimited risks. This is highly concerning if you are an investor in any derivatives products. There is an approx $700 trillion OTC Derivatives Iceberg with a tiny portion written off officially. The bottom line:
Are You Prepared?
 Stewart Thomson is president of Graceland Investment Management (Cayman) Ltd. Stewart was a very good English literature student, which helped him develop a unique way of communicating his investment ideas. He developed the “PGEN”, which is a unique capital allocation program. It is designed to allow investors of any size to mimic the action of the banks. Stewart owns GU Trader, which is a unique gold futures/ETF trading service, which closes out all trades by 5pm each day. High net worth individuals around the world follow Stewart on a daily basis. Website: www.gracelandupdates.com.


