Silver Market Update


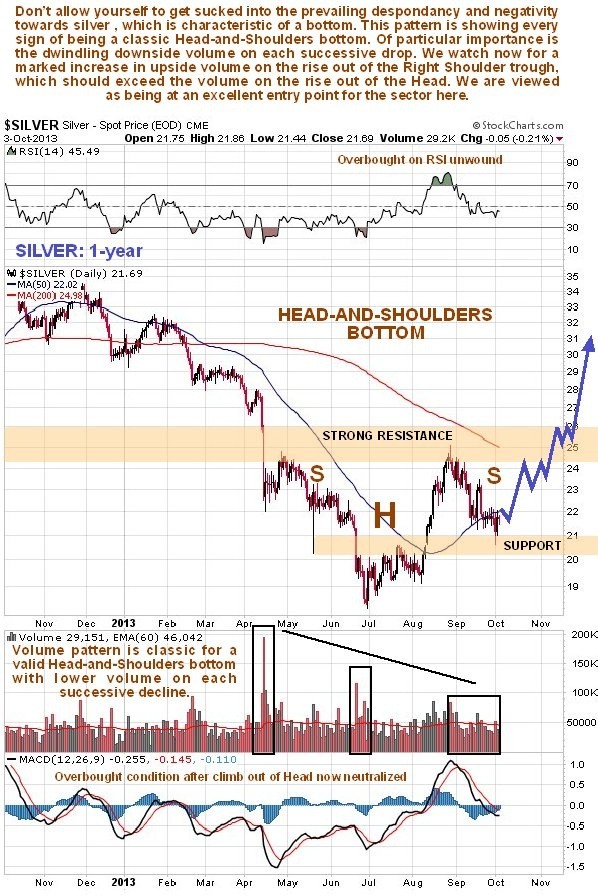
The reason for posting a new Silver Market update at this juncture is that we appear to be at an optimum “buy spot”, for gold, silver and Precious Metals ETFs and stocks, as both gold and silver have dropped back in recent weeks to mark out the Right Shoulder low of what is believed to be a large Head-and-Shoulders bottom.
The Head-and-Shoulders bottom in silver is more obvious than the one in gold, as it is more or less symmetrical. It is not down sloping as gold’s is, and has a horizontal neckline which not surprisingly coincides with a broad band of resistance at the top of it, as we can see on the 1-year chart for silver shown below. The silver price has dropped back in recent weeks to mark out the Right Shoulder low of the pattern, which should mean that we are at an optimum buy spot right now with the price very close to what is believed to be the Right Shoulder low. It should pick up again soon and advance to challenge the resistance at the neckline or top resistance line of the Head-and-Shoulders bottom. Astute traders will recognize the opportunity inherent in this setup, for if this H&S is indeed valid, then we are clearly at an excellent entry point at this Right Shoulder low, as a major uptrend should follow, but if the H&S pattern is false and the pattern aborts, then the proximity of support at the Right Shoulder low means that stops can set immediately beneath it and positions exited in the event that it breaks lower, for a minor loss. That said, however, it is considered unlikely that this reversal pattern will abort, because the volume pattern during the development of this Head-and-Shoulders bottom is exactly what one would expect of a valid pattern, with the volume on the decline to the Left Shoulder trough being high, that on the decline to the low of the Head being less, and that on the decline to the Right Shoulder trough being less again.
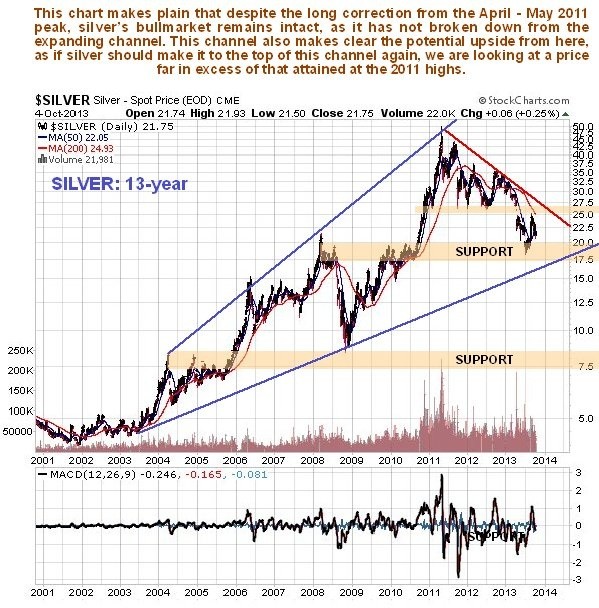
The long-term 13-year chart is, or should be, most heartening for silver bulls as it shows that the long-term uptrend remains intact and further that upside potential from here is very substantial, which should not be so surprising given that the cornered Fed has no choice but to continue with QE or even expand it, unless that is it wants to watch the markets implode and the economy collapse.
The latest COTs for silver (not shown) are bullish, although not at the bullish extremes that we saw late June – early July.
******
© 2004-2013 Clive Maund. Legal & Disclaimer
for billing & subscription questions: subscriptions@clivemaund.com
for all other inquiries: support@clivemaund.com
The above represents the opinion and analysis of Mr Maund, based on data available to him, at the time of writing. Mr Maund's opinions are his own, and are not a recommendation or an offer to buy or sell securities.
Mr Maund is an independent analyst who receives no compensation of any kind from any groups, individuals or corporations mentioned in his reports. As trading and investing in any financial markets may involve serious risk of loss, Mr Maund recommends that you consult with a qualified investment advisor, one licensed by appropriate regulatory agencies in your legal jurisdiction and do your own due diligence and research when making any kind of a transaction with financial ramifications.
Although a qualified and experienced stockmarket analyst, Clive Maund is not a Registered Securities Advisor. Therefore Mr Maund’s opinions on the market and stocks can only be construed as a solicitation to buy and sell securities when they are subject to the prior approval and endorsement of a Registered Securities Advisor operating in accordance with the appropriate regulations in your area of jurisdiction.
More from Silver Phoenix 500


