Silver Market Update


 Silver’s long bear market from its 2011 highs is believed to be “nested” within a larger bull market, along with gold’s, as discussed in more detail in the parallel Gold Market update, to which the reader is referred. This is an echo of what happened in the 70’s, when both gold and silver went into a heavy correction in 1975 and 1976 that was taken at the time to be a new bear market, but ended up leading into a massive parabolic ramp that took silver to dizzying heights as the Hunt brothers attempted to corner the silver market. The second major upleg of this bull market should take silver to levels that dwarf those of the 70’s peak, and this is not some deluded fantasy but based on a sound assessment of the trends in currencies and debt now extant.
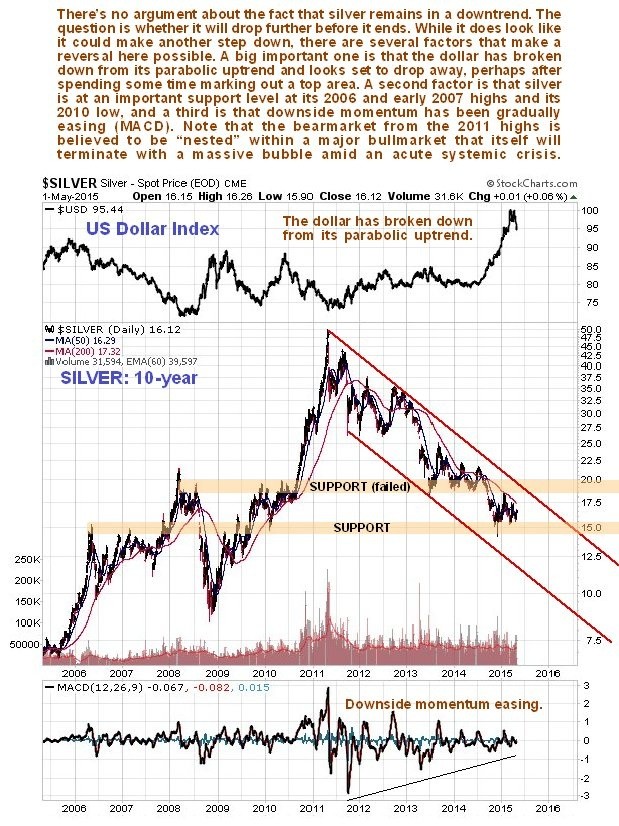
If the above is true, then the question becomes “When will this long downtrend from 2011 end?” On the long-term 10-year chart for silver we can see that at first sight there is little sign of it ending, but if we look closer we can see several factors that could lead to a reversal, either after another step down, or even without that. The first is that the dollar spike has burned itself out – the dollar index is shown at the top of this chart – which is due to two things, the market’s realization that the Fed’s talk about raising rates was a bluff to suck foreign mug’s funds into the US (talk is cheap), and also the Greek crisis blowing over as Europe’s leaders get with the plot and power up their own QE engine. Another factor that could generate a reversal here is that the silver price has dropped to another important support level, at the 2006 and early 2007 highs, and at the 2010 lows, where the trading range of recent months has developed. Still another factor is that the downside momentum of the long downtrend has been easing steadily as it has progressed, as shown by the MACD indicator at the bottom of the chart. All these factors increase the chances of a reversal occurring here, even if the price pattern itself suggests another step down towards the lower boundary of the downtrend. A critical factor in all this is likely to be the action of the dollar index – once it confirms that it has completed an intermediate top by breaking down below 94, gold and silver are likely to take off strongly higher. We look at the dollar in the Gold Market update.
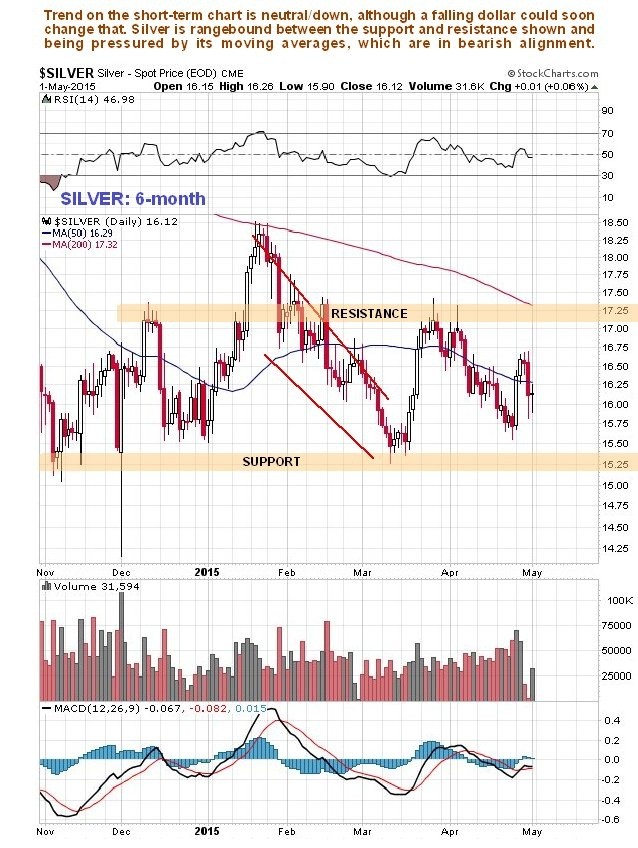
The short-term 6-month chart reveals that silver is currently range bound between the support and resistance shown, but is being pressured to break down by its bearishly aligned and falling moving averages.
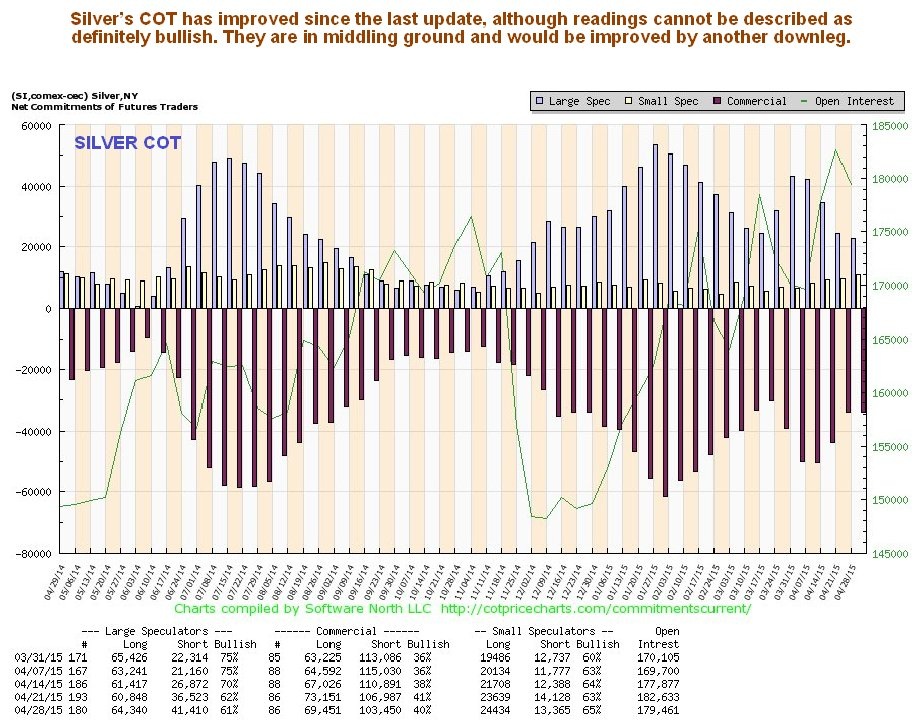
Silver’s latest COT shows that, while readings have certainly improved since the last update, they cannot be described as definitely bullish, and are in middling ground. Another step down by silver, which may yet happen, would improve these readings and turn them bullish.
The silver Hedgers chart, which is form of COT chart that goes back further, is in middling ground, and doesn’t give guidance one way or the other regarding direction at this time.
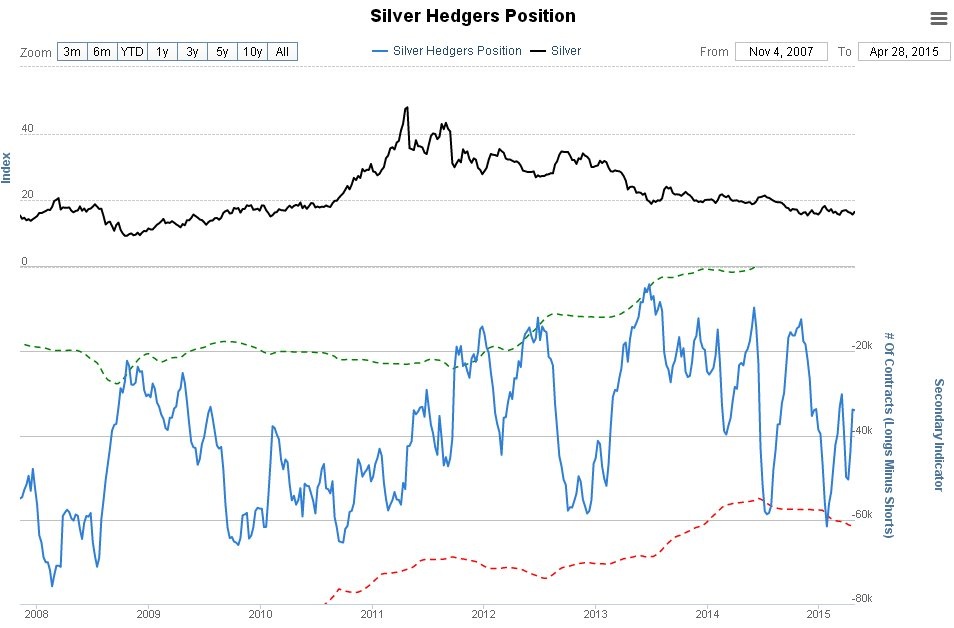
Chart courtesy of www.sentimentrader.com
The Silver Optix or Optimism chart is also in middling ground, although a little more bullish than the Hedgers chart.
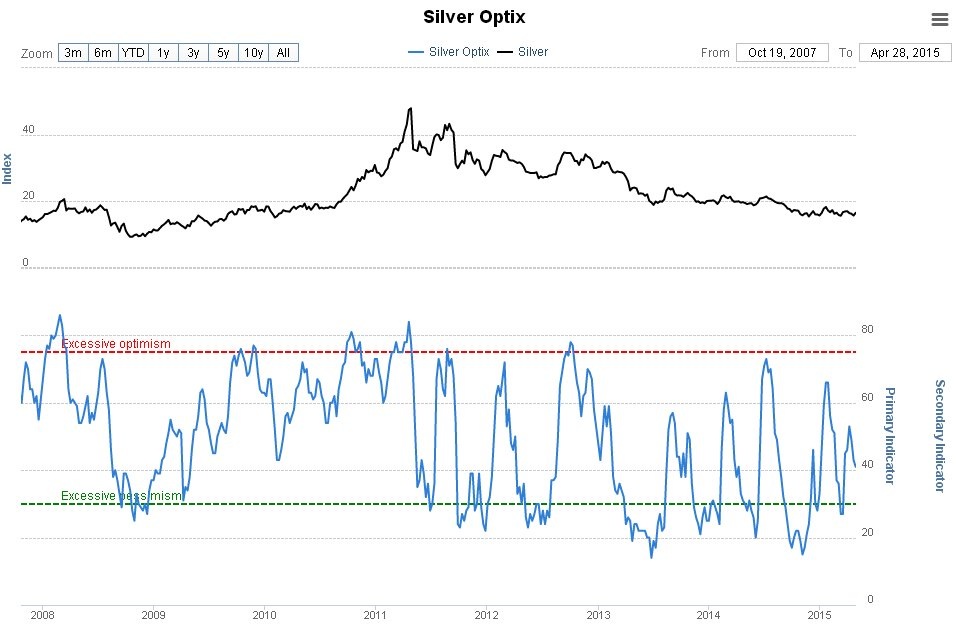
Chart courtesy of www.sentimentrader.com
********
Courtesy of http://www.clivemaund.com
More from Silver Phoenix 500


