Silver Market Update


A lot of folks are waxing lyrical about silver, about what a great oversold undervalued investment it is, that is Real Money and how it is leveraged to gold and thus even better etc etc. The only problems are that it happens to be stuck in the same grueling downtrend that has driven it lower and lower for 4 years, and the Commercials are heavily short. Given that the folks waxing lyrical are romantics, and that the Commercials are pragmatists who make money nearly all of the time, you ought to be able to figure from this which side of the equation you should be on. It is not that the romantics are necessarily wrong in their positive assertions regarding silver – their problem would appear to rest with the small matter of timing.
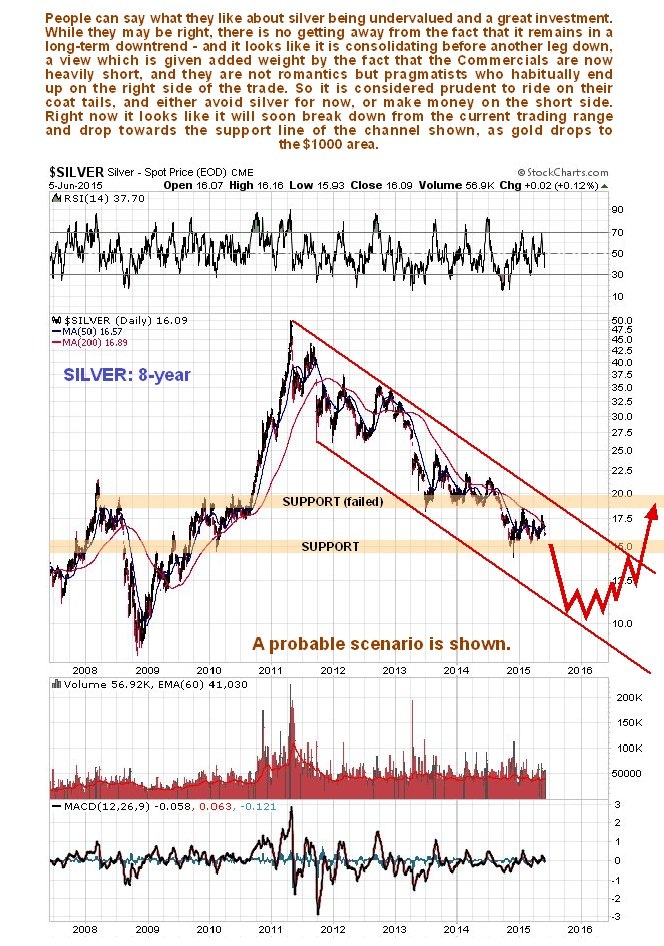
You can see silver’s problem plainly on its 8-year chart – the big ugly downtrend in force from its blowoff top highs 4 years ago. There is still no sign of this downtrend ending – on the contrary, with the Commercials having just piled on the shorts again, it looks like it is setting up for another breach of support leading to another steep downleg. Even without reference to the COTs this chart is not a pretty sight for longs, with the sideways trading range that has formed all this year looking like just another consolidation in an ongoing downtrend. If it breaks down below its lows of late last year soon as expected, then it is probably headed down to the support near the lower boundary of its major downtrend, which gives us a target for the move towards $10.
It’s not all doom and gloom though. The long-term outlook for both gold and silver is considered to be excellent, as after the initial 2008 style panic phase of the system flying apart again, gold and silver look set to be about the only game in town. Bonds are worthless junk – not just the so-called “Junk Bonds” but all of them – who in their right minds holds paper in governments, corporations or municipalities etc that are either bankrupt or up to their necks in debt? Once slow-witted bond investors start to grasp this reality – and they are starting to grasp it – interest rates will spike dramatically, and there will be absolutely nothing the Fed can do to stop this, and no-one will give a damn any more whether they are “patient” or not. Bondmarkets will crash, then stockmarkets and we will be headed into depression, which is actually necessary to purge the system of all this dross of debt, which has lead to the current bizarre distortions, like savers receiving no interest. Gold and silver do well in these circumstances, just as they did in the 30’s, and even if they fall in price, they fall less than everything else, so are actually going up in real terms. This meltdown is not years away – it is believed to be almost upon us.
What all this means is that while we are looking for another downleg in gold and silver, we will also be keeping an eagle eye out for the final bottom, which is expected to follow this final downleg, which should see gold bottom between about $850 maximum low, the lower boundary of its downtrend channel, and $1000, where there is strong support.
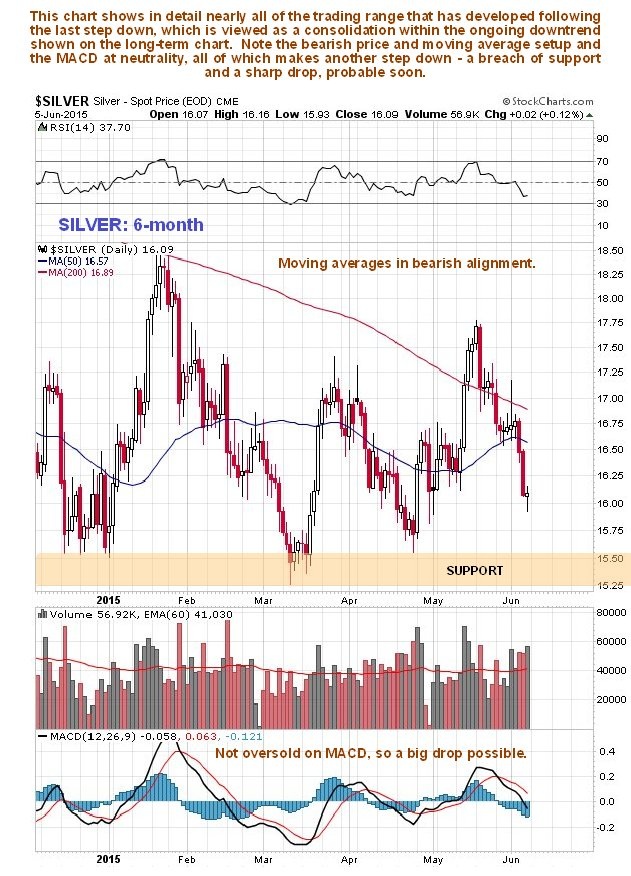
The 6-month chart for silver shows in detail the trading range that has formed this year, that is viewed as a consolidation within the ongoing downtrend shown on the long-term chart. While this chart by itself is almost useless, because “you can’t see the wood for the trees”, it does reveal how silver is coming under increasing pressure from its bearishly aligned moving averages and since it is not oversold at all on its MACD indicator, it could drop hard soon.
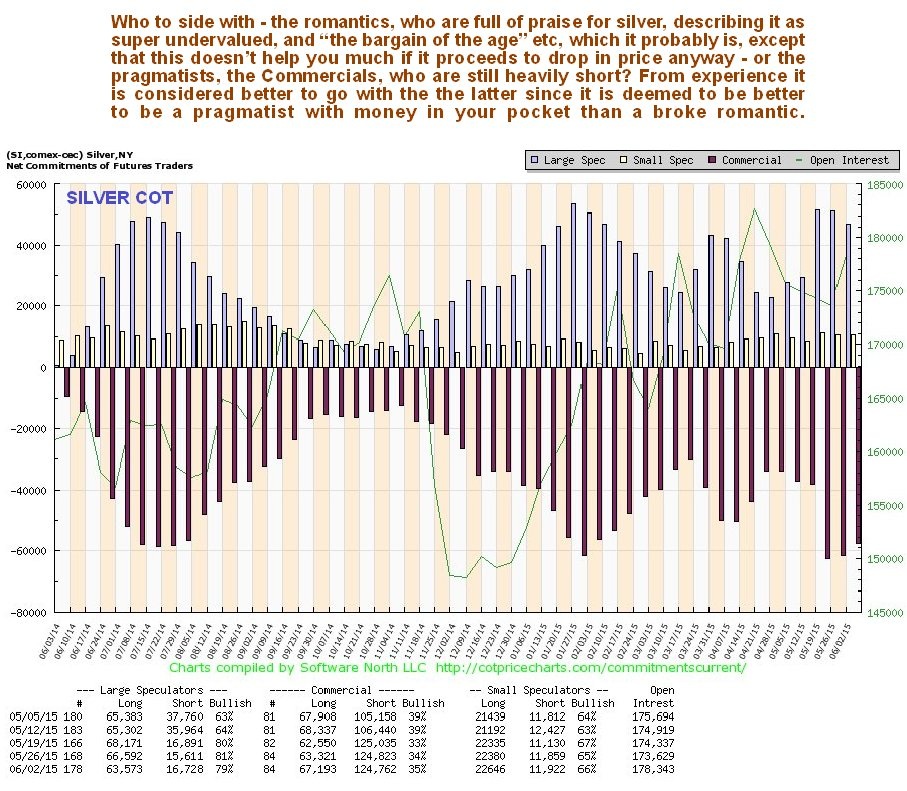
Although silver’s COT moderated somewhat last week, it is still heavily bearish, with a very high Commercial short position, and since these guys nearly always “come up smelling of roses”, we know which side of the fence we want to be on…
The silver hedgers chart, a form of COT chart going back much further, is likewise bearish, and points to another downleg…
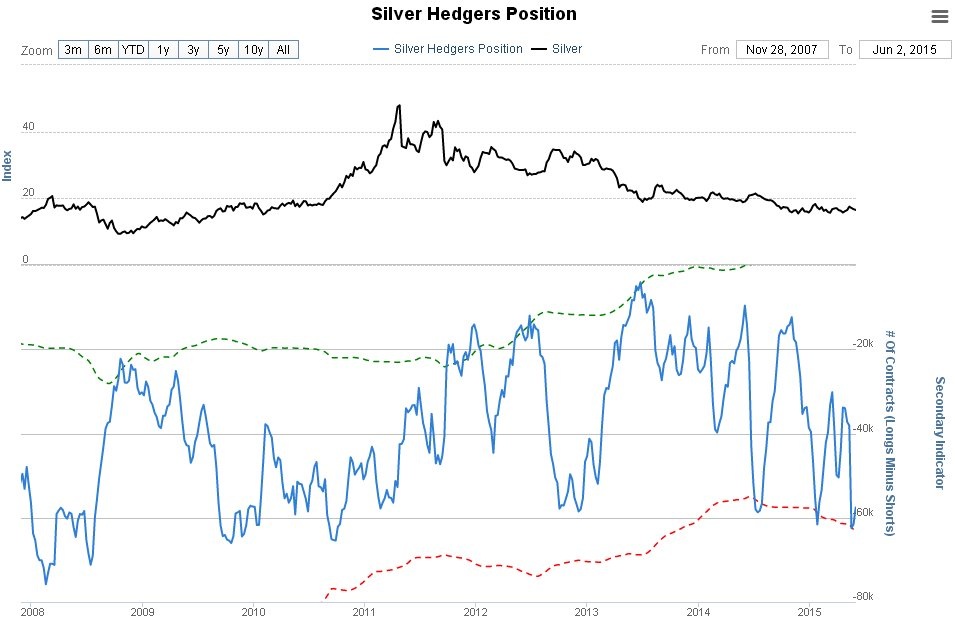
Chart courtesy of www.sentimentrader.com
The silver optix, or optimism chart, is in middling ground with a bearish bias…
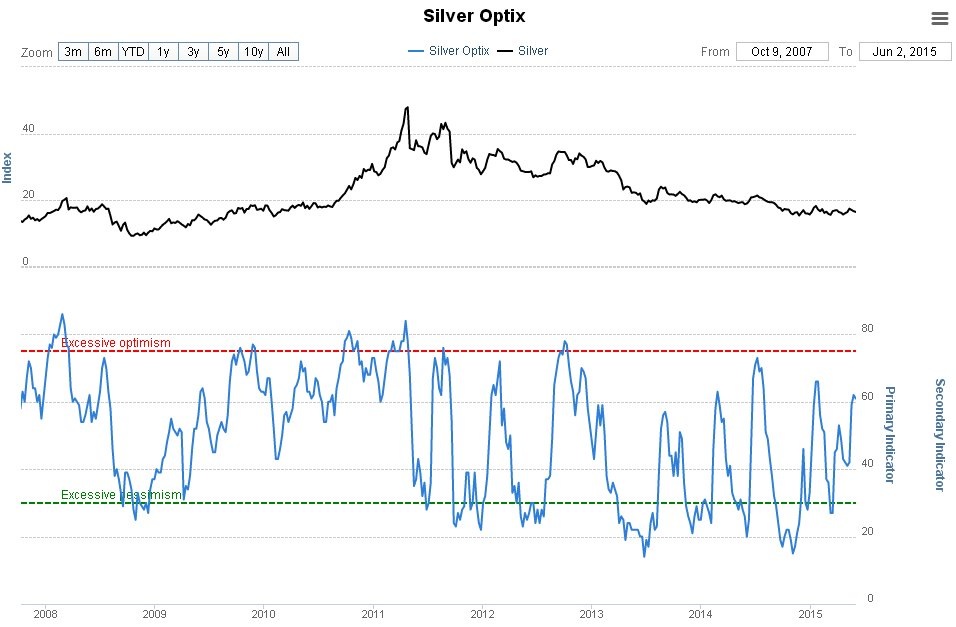
Chart courtesy of www.sentimentrader.com
Conclusion: silver looks set to break down soon from the trading range that has formed since late last year into a downleg that takes it towards or to the lower boundary of its downtrend channel shown on its 8-year chart. To abort this scenario it needs to break out upside from its major downtrend, preferably on good volume, which would be a buy signal. The expected downleg should complete silver’s “bearmarket within a larger order bullmarket”, and thereafter it is expected to reverse into an uptrend that promises to dwarf that of the late 70’s.
********
Courtesy of http://www.clivemaund.com


